6 minNovember 20, 2026

Our tools monitor millions of native, push, pop, and TikTok advertising campaigns.
Get StartedAI is quietly becoming your new top-of-funnel, but your dashboards are still stuck in a world where discovery equals “clicks from Google.” Buyers are asking Gemini what tools to use, comparing vendors in ChatGPT, and reading Reddit threads that Perplexity cites back to them—often without touching your website until they’re much later in the journey, if at all. As one analysis of AI-era discovery explains, analytics now lag behind the way people actually find brands, forcing marketers to move beyond legacy, traffic-centric reporting toward a framework grounded in demand, engagement, and assisted conversions across channels, not just measurable search-result page views (MarTech).
This shift creates a paradox. Your AI visibility can be climbing—more mentions in AI Overviews, more citations in ChatGPT answers, more inclusion in “top tools” lists—while your traditional SEO and web analytics reports show flat or even declining performance. When AI systems summarize answers in-line, route users through native product cards, or delay the click until after multiple interactions, standard attribution collapses. Revenue still moves, but it shows up as “direct,” “brand search,” or “dark social,” not as clean organic sessions you can pin to a keyword and a landing page.
That’s why “What’s our average rank?” has quietly become the wrong question. Rank assumes a static results page and a universal experience. AI discovery breaks both assumptions. A single category query can produce different answers across users and sessions, and a personalized AI summary can surface your brand prominently or bury it in a secondary mention. In this environment, performance marketers need to pivot from position-based thinking to visibility-based thinking—how often you appear, how prominently, and in which moments of the journey.
Some teams are already adopting AI visibility rate and AI Share of Voice as core metrics, tracking how frequently their brand is recommended across many prompts and platforms rather than obsessing over a single SERP snapshot (MarTech). This extends traditional Share of Voice logic to AI surfaces by measuring how often a brand appears relative to competitors in AI answers across platforms such as ChatGPT, Gemini, and AI Overviews (Ahrefs).
The measurement problem gets worse as more value moves into zero-click and assisted journeys. If ChatGPT introduces your product, TikTok creators validate it, and Google captures the eventual branded search, the last-click report gives all the credit to “organic search” or “paid brand,” none to AI discovery. That’s why analytics leaders are being pushed toward multi-touch attribution and incrementality methods that treat AI visibility signals—citations, brand mentions, recommendations—as assistive exposure, not ignorable noise.
Recent full-funnel frameworks tie those AI signals to downstream performance using media mix modeling and cross-channel correlations, effectively swapping fragile click-based KPIs for a combination of visibility, influence, and impact metrics that make sense in an AI-dominated landscape (Search Engine Journal).
Compounding the challenge, model volatility introduces noise that looks like marketing performance. A single LLM update can spike or crater your AI presence overnight, long before your content or budgets change. Without a clear log of model shifts next to your visibility data, it is easy for a leadership team to misread algorithm turbulence as campaign success or failure.
At the same time, because AI discovery engines often spark delayed intent, their impact tends to surface indirectly—in rising direct traffic, growing brand-name search volume, and more social mentions. AI systems also draw from community platforms like Reddit, YouTube, and LinkedIn, which can influence what buyers encounter before they ever visit your website (MarTech).
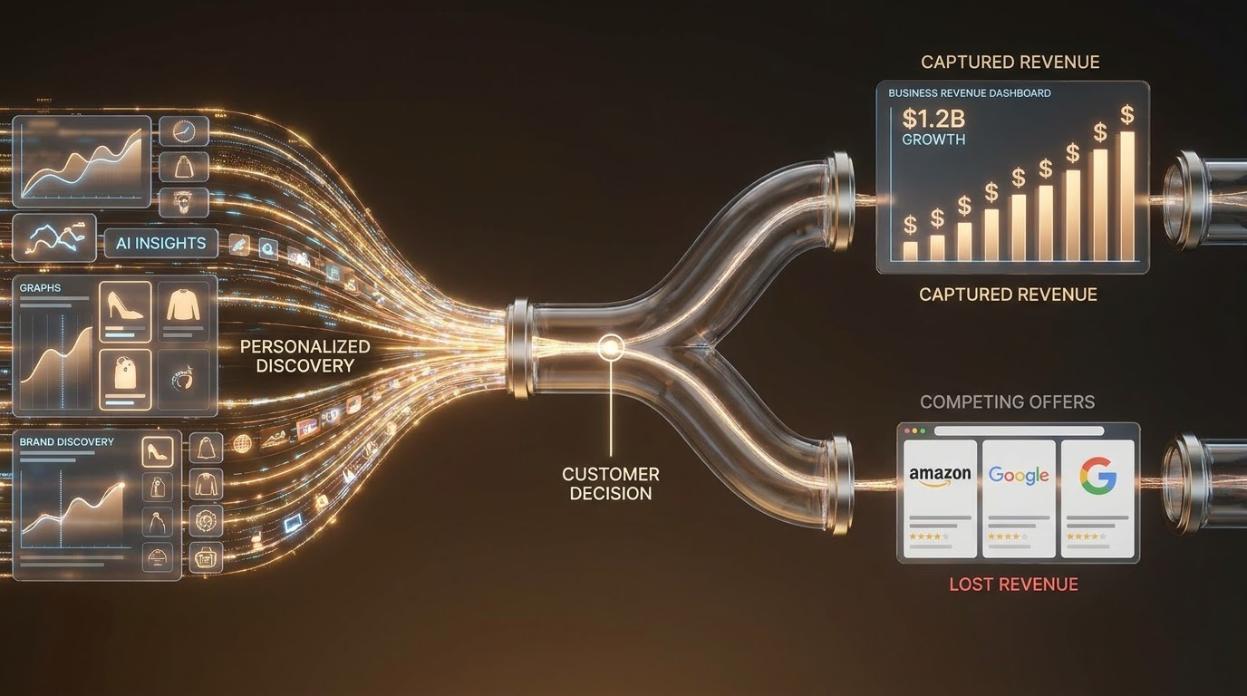
This is the core problem performance marketers now face: AI is rapidly expanding your real-world “share of answer,” while the metrics your organization trusts most still revolve around channels and clicks. Until you can connect AI Share of Voice to concrete demand, pipeline, and revenue signals, every conversation about AI discovery risks sounding like vanity.
The rest of this framework is about closing that gap—moving from “We’re visible in AI” to “Our AI-driven visibility is measurably growing offer share of wallet.”
Traditional “share of voice” metrics were designed for a world where discovery was a proxy for traffic, and traffic was a decent proxy for revenue. AI has broken that chain. Measuring how often your brand is mentioned in AI answers is useful, but for performance marketers, it’s not the finish line. The job is not to win “AI mindshare” in the abstract; it’s to win budgeted deals. That means evolving from AI Share of Voice to something closer to “Offer Share of Wallet.”
AI Share of Voice (AI SoV) is, at heart, a visibility metric. It tells you how often your brand appears in AI answers relative to competitors, across the prompts you care about. A common approach calculates it as mentions of your brand divided by mentions of all tracked brands in those responses, then multiplied by 100, as outlined in the Ahrefs guide to AI Share of Voice.
Platforms like Brand Radar and Semrush’s AI Visibility Toolkit help quantify how often brands appear in ChatGPT, Gemini, Perplexity, or other AI-powered discovery experiences for a defined set of commercial questions. These tools turn individual responses into a comparative visibility metric.
That’s a powerful diagnostic. It reframes “Are we visible in AI?” as “What percentage of AI-driven discovery are we actually winning?”—the same way classic Share of Voice reframes rankings into a broader competitive visibility question (Ahrefs). But the number is still just that: a percentage of answers, not a percentage of pipeline.
If AI is becoming a primary research assistant for buyers, then the performance marketer’s real question is closer to: “When our category shows up in AI, how often is our specific offer positioned to capture the budget?”
That’s where Offer Share of Wallet comes in.
Offer Share of Wallet is a proposed downstream, revenue-facing extension of AI SoV. Instead of asking, “What proportion of AI answers mention our brand?,” you ask, “Within the budgeted opportunities influenced by AI answers, what proportion of the spend flows to our offers versus competitors’?”
It links discovery to dollars.
Conceptually, you can think of the chain like this:
The middle step matters because AI visibility alone does not establish commercial impact. A review of AI search analytics tools reported findings suggesting that AI-sourced visitors can show substantially different engagement and conversion behavior from traditional organic visitors, including figures of 4.4 times higher conversion and 68% more time on site in the data it discussed (HubSpot). Those figures should be treated in the context of the underlying study and its methodology, not as universal benchmarks for every business.
The broader point remains: AI exposure may represent valuable attention. But until you connect that attention to actual revenue, you’re still stuck arguing with leadership about why a visibility line on a dashboard should influence budget.
Offer Share of Wallet reframes the argument in familiar language for executives. It’s no longer “we gained 5 points of AI SoV,” it’s “within AI-influenced opportunities in our pipeline, our offers now capture 32% of total contract value, up from 21% last quarter.”
It borrows the strategic framing that Share of Voice can help anticipate market-share movement (Ahrefs), but pins that logic directly to deal value instead of clicks or visits.
Crucially, this shift also respects how messy attribution has become. AI answers synthesize social posts, forums, review sites, and third-party content. Your brand’s presence in that ecosystem can show up indirectly in AI SoV, as the Semrush guide explains.
Offer Share of Wallet accepts that you may never see a clean “AI → click → form fill” path. Instead, it defines success at the level of influenced revenue: if your AI Share of Voice is growing and AI-sourced segments show stronger engagement and conversion, your goal is to ensure a growing proportion of actual spend in those influenced deals goes to your offers.
In other words, AI Share of Voice tells you how loud your brand is in the AI conversation. Offer Share of Wallet tells you how much of the check you’re actually taking home.
For performance marketers, the framework only becomes truly actionable when you optimize—and report—against both.
Most teams are staring at the wrong dashboards. On one screen you’ve got AI discovery monitors telling you how often ChatGPT, Gemini, or Perplexity mention your brand. On another, you’ve got ad spy tools showing your competitors’ latest funnels.
Alone, each view is incomplete. Together, they form a dual-lens model that can help connect “AI Share of Voice” to “Offer Share of Wallet.”
Think of this as two complementary questions:
The job of this section is to bring those two views together into a practical measurement framework performance marketers can act on.
AI discovery data starts with the basics: how often your brand is cited or recommended for the prompts that matter. Tools built around concepts like AI Share of Voice help you track the percentage of answers where you appear versus competitors for high-intent prompts such as “best payroll software for 50–200 employees,” “alternatives to X,” or “pricing for Y platform.”
But the number only becomes meaningful when it is weighted by real-world demand across those prompts and engines, not treated as a vanity percentage in isolation. You need to know whether you’re winning on low-value queries or on the prompts that precede budgeted decisions.
This is where performance marketers should expand beyond simple visibility and layer in behavioral proxies. Analysts looking at AI search have proposed replacing pure click-based reporting with a KPI stack built around visibility, influence, and impact: track citations and recommendations, then model how those off-site exposures relate to brand-demand signals, multi-touch paths, and revenue using techniques such as incrementality testing and media mix modeling (Search Engine Journal).
Practically, your AI discovery lens should answer:
This gives you a map of algorithmic recommendation power. But it doesn’t yet tell you whose offers are actually absorbing wallet share once buyers move from assistant to action.
Ad spy tools across Meta, TikTok, Google, YouTube, and programmatic channels can provide a view of how brands are presenting and promoting offers in your category. If AI assistants are part of the recommendation layer, ad libraries and creative research tools provide a view of the commercialization layer.
Where AI discovery shows which brands appear in the shortlist, ad spy intelligence helps reveal:
In a world where AI is compressing research into a handful of conversational turns, what matters is the bridge between that compressed consideration set and the first serious commercial interaction. Ad spy data lets you investigate that bridge.
To make this useful for performance measurement, treat every competitive ad and landing page you catalog as a hypothesis about how buyers want to buy in an AI-mediated world.
Use this lens to tag:
By tracking which archetypes persist and proliferate over 30–90 days, you can develop a directional view of which offers competitors continue to support. However, ad longevity or frequency alone does not prove profitability, conversion rate, or return on ad spend. These observations should be treated as competitive signals and tested against your own performance data.
When you put these lenses together, you stop measuring AI visibility in a vacuum and start understanding its possible relationship to commercial outcomes.
Here’s how to operationalize the dual-lens model:
1. Map prompts to paths, not pages.
Start by clustering your AI prompts into intent segments: “learn,” “compare,” “switch,” and “buy now.” For each cluster, log which brands the major assistants prefer and how they phrase the recommendations.
This aligns with the idea of rebuilding the funnel around the AI discovery layer rather than around page-level visits. It also gives you a more useful way to compare AI exposure with the commercial activity that follows.
2. Attach each prompt cluster to observed offer patterns.
For every intent cluster, review ad libraries and competitive research tools for the dominant creative and offer archetypes.
For instance:
Tag these as “migration offer,” “price-sensitive offer,” “expansion offer,” and similar categories.
3. Construct AI-to-offer pathways.
For each cluster, define the expected sequence:
Even when click data is missing, you can still measure the shape of this path through correlations in brand search lifts, direct traffic, and assisted conversions. These are among the dimensions marketers are encouraged to consider when updating analytics for AI-era discovery (MarTech).
4. Quantify Offer Share of Wallet proxies.
You will rarely have direct access to competitors’ revenue, so you need proxies that tie the dual lens back to your own performance data.
Track:
When your AI Share of Voice increases in a given intent cluster and you also see your relevant offer archetype gain ground in competitive visibility and internal performance metrics, you have a stronger basis for arguing that your Offer Share of Wallet may be rising.
The evidence is still directional unless supported by reliable revenue attribution or testing.
5. Close the loop with experimentation.
Use the dual lens to design experiments:
The objective is not simply to copy what competitors are advertising. It is to use AI discovery insights and competitive offer intelligence to develop better commercial responses—and then validate whether those changes actually improve performance.
Start with the destination in mind: Offer Share of Wallet is the percentage of in-market spend, for a specific problem or job-to-be-done, that ends up going to your offer instead of a competitor’s.
This is a proposed measurement framework, not an established universal industry metric. Its usefulness depends on how clearly you define the market, identify relevant opportunities, and estimate the available category spend.
The framework below works backward from that outcome to build a measurable, AI-aware system that performance marketers can actually optimize.
You’re not measuring “marketing” in general; you’re measuring whether a specific offer is winning budgeted deals.
For each offer, nail down:
This is where your AI discovery tools and Share of Voice products do the reconnaissance: Which brands and offers repeatedly appear in AI Overviews, ChatGPT, Gemini, and Perplexity for those jobs?
As the team behind the Ahrefs AI Share of Voice guide explains, you want to mirror the prompts and competitor set that actually define your market.
Before you can measure Offer Share of Wallet, you need to be clear on which wallet you’re trying to win. That starts with three choices most teams skip past: vertical, geography, and funnel stage. Get these wrong and your AI discovery data, your ad data, and your revenue numbers will never quite line up.
First, narrow your vertical.
AI Share of Voice is inherently comparative: it is your brand’s mentions divided by the total mentions across tracked brands in your category, as the Semrush team explains.
If you’re a project management tool, that category cannot simply be “SaaS in general.” It needs to be something more specific, such as “project management platforms for mid-market B2B teams,” “construction project management,” or “creative agency work management.”
Why that level of precision?
Practically, your vertical definition should match how you segment pipeline and revenue in your CRM. If you don’t track “SMB ecommerce” separately from “mid-market ecommerce,” your discovery framework shouldn’t either.
The goal is backward compatibility: every uplift in AI SoV should be mappable to an opportunity segment your finance and RevOps teams already recognize.
Next, fix your GEO.
AI visibility is not globally uniform. AI-generated answers can vary by region, language, and local context. When Semrush’s AI Visibility Toolkit calculates AI SoV, it asks users to set a target location and language before comparing performance (Semrush).
If 80% of your revenue comes from North America and DACH, you don’t want a blended global SoV score that quietly averages in prompts from APAC where you don’t even sell.
Similarly, if you run country-specific media plans and local pricing, you need country-level or at least region-level AI discovery views so you can match:
This is the only way to answer questions like, “We increased AI visibility in the UK—did our Offer Share of Wallet among UK buyers for this use case actually move?”
Without a GEO definition locked in, every insight collapses into un-actionable averages.
Finally, decide where in the funnel you’re measuring.
AI answer engines can influence discovery, consideration, and even late-stage validation, but different KPIs matter at each stage. Full-funnel AI measurement frameworks emphasize the need for separate metrics for visibility, influence, and impact (Search Engine Journal).
A simple way to force discipline is to declare one primary funnel stage for each framework you build:
For a given vertical and GEO, pick the dominant funnel stage you care about for that measurement loop. You can build multiple frameworks over time—one for category creation, another for competitive displacement—but each needs a single, explicit funnel stage so you can choose the right prompts, benchmarks, and KPIs.
When vertical, GEO, and funnel stage are all explicit, you stop chasing abstract AI visibility and start measuring something concrete: “Within this segment of the market, in this geography, at this stage of the journey, how much of the buyer’s wallet is realistically up for grabs—and how much of it are we winning?”
Once you know which wallet you’re going after, the next job is understanding where AI can actually influence that spend. That means mapping the AI discovery landscape for your vertical, GEO, and funnel stage, then turning that map into something you can measure and optimize.
Start with the platforms and surfaces that realistically matter for your buyer. A B2B SaaS team selling in North America will see a different AI mix—ChatGPT, Gemini, Perplexity, LinkedIn integrations, and enterprise copilots—than a local services business in Europe, which may rely more heavily on Google AI Overviews, Bing Copilot, Apple’s native answers, or niche vertical tools.
The goal is not to chase every new interface. It is to identify the handful of AI channels that can plausibly influence awareness, consideration, or selection for this offer and this region.
From there, inventory the specific AI surfaces where your category shows up today. For search-like experiences, that typically means:
This is where AI Share of Voice comes in. Rather than asking “Are we visible in AI?” you want to quantify “How much of the AI market conversation are we winning?”
Tools built around AI SoV apply the same logic as traditional Share of Voice: they measure how often your brand is mentioned in AI answers versus competitors across a defined prompt set.
For example, Ahrefs’ Brand Radar uses AI Share of Voice to show how frequently a brand appears in responses from ChatGPT, Gemini, and AI Overviews compared with tracked competitors, turning raw answers into a comparable visibility metric for a defined category and region (Ahrefs).
But raw visibility is only one axis of the landscape. You also need to know whether that visibility is comparative and competitive.
Competitor Share of Voice looks at how often a brand is cited relative to other brands mentioned in the same answer, including how prominent and favorable those mentions are (HubSpot).
In other words, it’s not enough that AI assistants name you. What matters is whether you’re consistently preferred, tied, or an afterthought when your products are listed alongside alternatives.
With platforms and surfaces in view, the next layer is intent and funnel stage. You can’t optimize AI discovery in the abstract; you can only optimize visibility around concrete prompts tied to real buying jobs.
Take the universe of prompts people might use in your vertical and sort them into:
Modern AI search measurement frameworks recommend building prompt libraries that mirror your funnel, then tracking AI mentions, citations, and recommendations across that library as a structured dataset rather than a pile of screenshots (Search Engine Journal).
Finally, overlay impact potential on top of this map.
Some platforms and prompts are more valuable than others. Weighted AI Share of Voice—where prompts are weighted by search volume, estimated AI-adjusted demand, or downstream conversion propensity—prevents you from treating “best [category] software” and “nice-to-have side feature” as equally important.
As the Ahrefs AI Share of Voice guide illustrates, the same percentage share across prompts can be misleading if one query represents a much larger portion of demand. Weighting answers by their estimated importance produces a more useful picture of your opportunity space.
The output of this step is a living map: a shortlist of AI platforms, the answer surfaces within them, the prompts that matter by funnel stage and GEO, and an initial view of how visible and competitive you are in each area.
That map becomes the backbone for everything that follows. It helps you decide which AI metrics to track, where to run tests, and ultimately where AI discovery is most likely to shift your offer’s Share of Wallet.
Next, translate buying scenarios into the prompts buyers actually type or speak into AI systems.
For each scenario, list:
Use AI visibility tools or scripting to track:
Platforms that measure AI Share of Voice across ChatGPT, Gemini, and AI Overviews provide a percentage of total tracked mentions (Ahrefs).
That becomes your AI Discovery Index for the offer.
AI discovery is often linkless, so you need a bridge from “named in the answer” to “money hit the table.”
Following the guidance of practitioners who argue for moving beyond legacy traffic-centric reporting, track lagging indicators of demand such as:
A spike in branded search and direct visits after your visibility rises in ChatGPT, Perplexity, or AI Overviews may be an early measurable signal associated with those AI recommendations. Users may explore community sources such as Reddit, YouTube, and LinkedIn before returning through a different channel or device.
That gives you an Offer Demand Lift metric: how much incremental brand demand appears when AI discovery for the offer goes up.
To calculate it, establish a baseline for the relevant brand and product demand signals, then compare performance after a measured change in AI visibility. Control for seasonality, campaign launches, pricing changes, and other external factors wherever possible.
A rise in demand after an AI visibility increase is useful evidence, but it does not by itself prove that AI exposure caused the increase.
Now connect that demand to revenue, but resist falling back to last-click dogma.
When early exposures happen in AI and community environments that your analytics cannot directly observe, attributing a conversion only to the click that precedes a sale can paint an incomplete picture.
For each offer, configure:
In practice, your analytics should help answer:
“Over the past 90 days, how many conversions for this offer included at least one branded visit or mid-funnel interaction after a period when AI visibility increased?”
That becomes your Offer-Assisted Conversion Rate as AI influence rises.
Keep the measurement definition consistent. Decide which events count as an assisted conversion, how long the attribution window should be, and whether you are measuring leads, qualified opportunities, closed deals, or revenue.
Now you can approximate the thing you actually care about: the offer’s share of spend.
For a given period and market:
1. Estimate the available wallet.
Use market sizing, category benchmarks, customer research, or your own CRM to estimate total spend in that segment.
For example, you might estimate $10 million in annual SMB agency project management software spend in North America.
The estimate should match your chosen vertical, GEO, customer segment, and period. A broad market-size number that includes customers you cannot serve will distort the result.
2. Calculate your offer’s captured wallet.
Sum revenue tied to the offer over the same period. Depending on the business model, you may use:
Where direct revenue attribution is messy, use a clearly labeled proxy. For example, organic traffic value for offer-intent keywords can be multiplied by close rate and average deal size to estimate potential value. This resembles the use of organic traffic value as a dollar proxy when direct revenue tracking is imperfect (Ahrefs).
3. Compute Offer Share of Wallet.
Offer Share of Wallet = (Offer revenue captured ÷ Estimated category wallet) × 100
For example, if an offer captures $1.2 million in revenue from an estimated $10 million category wallet, its estimated Offer Share of Wallet is 12%.
This gives you an offer-level market-share estimate that leadership can understand.
However, the result is only as reliable as the available-wallet estimate and the revenue calculation. If your denominator is an estimate, your final percentage is an estimate too. If the numerator includes revenue that cannot reasonably be connected to the defined market or offer, the comparison will be misleading.
Where possible, report the assumptions and confidence level alongside the percentage.
The final step is to make this framework actionable.
For each offer, regularly correlate:
When you can say, “A 10-point gain in AI Share of Voice for ‘SOC 2 automation’ preceded a 15% lift in branded demand and a 6% gain in estimated Offer Share of Wallet in Q3,” you have moved beyond vanity AI visibility metrics into a performance system.
The word preceded matters. A sequence of changes can show a meaningful relationship, but it does not establish causation on its own. Controlled experiments, incrementality testing, and careful analysis of other market changes provide stronger evidence.
From there, the job of the performance marketer is clear: identify which AI-facing moves—content, PR, reviews, partnerships, and technical optimization—most efficiently shift those four dials for each offer.
Then reallocate budget toward the tactics that demonstrably grow your share of wallet, not just your share of answers.
AI discovery is changing how buyers research, compare, and select products. But the challenge for performance marketers is not simply proving that a brand appears in more AI answers. It is understanding whether that visibility contributes to demand, influences buying decisions, and ultimately helps the business capture more revenue.
AI Share of Voice provides the starting point. It shows how frequently your brand appears in relevant AI conversations compared with competitors. It helps identify where you are visible, where you are being overlooked, and which prompts deserve attention.
But visibility is only one part of the picture.
By combining AI discovery data with competitive ad intelligence, marketers can begin connecting prompts to offer patterns, brand demand, assisted conversions, and revenue outcomes. The proposed Offer Share of Wallet framework takes that process one step further by giving teams a way to estimate how much of the available category spend their offers capture.
The distinction is important:
None of these metrics should be interpreted in isolation. AI visibility can fluctuate because of model updates, competitive activity, and changes in the way platforms generate answers. Ad longevity does not guarantee profitability, and a rise in branded search does not automatically prove AI caused the increase.
The strongest measurement system combines consistent tracking, clear market definitions, reliable revenue data, and controlled testing wherever possible.
This is also where competitive intelligence becomes valuable. Understanding which brands are appearing in AI recommendations is only half the job. Seeing how those brands position their products, structure their offers, communicate value, and compete for buyer attention gives performance marketers a clearer view of what happens after discovery.
Tools such as Anstrex can support this research by helping marketers examine competitive advertising activity, creative approaches, and offer positioning. That intelligence can inform better hypotheses and experiments, while internal analytics and revenue data determine whether those strategies actually work.
The goal is not to chase every AI mention or copy every competitor’s campaign. It is to identify the discovery moments that matter, understand the offers competing for the same budget, and invest in the strategies that produce measurable commercial results.
The future of performance marketing will not be measured by visibility alone. It will be measured by how effectively brands turn discovery into demand—and demand into revenue.
Receive top converting landing pages in your inbox every week from us.
Featured
Discover how specialized AI agents can work together to monitor competitors, turn insights into experiments, launch campaigns, and scale winning strategies while keeping human oversight and governance in place.
David Kim
7 minNov 20, 2026
Quick Read
AI visibility is growing, but traditional analytics often fail to show its contribution to revenue. This framework connects AI discovery data with competitive ad intelligence, demand signals, assisted conversions, and offer-level revenue to help performance marketers measure whether AI-driven discovery is translating into business results.
Liam O’Connor
7 minNov 20, 2026
Most Read
Performance marketers don't need another prompt or disconnected AI tool. They need a coordinated system of agents that can monitor competitors, connect fragmented marketing data, test creative and funnel hypotheses, and surface better decisions. Explore how to move from prompt wrangling to commanding an intelligent performance marketing operation.
Priya Kapoor
7 minNov 19, 2026