10 minNovember 5, 2025

Our spy tools monitor millions of TikTok ads from over 55+ countries. Biggest TikTok Ad Library in E-commerce and Mobile Apps!
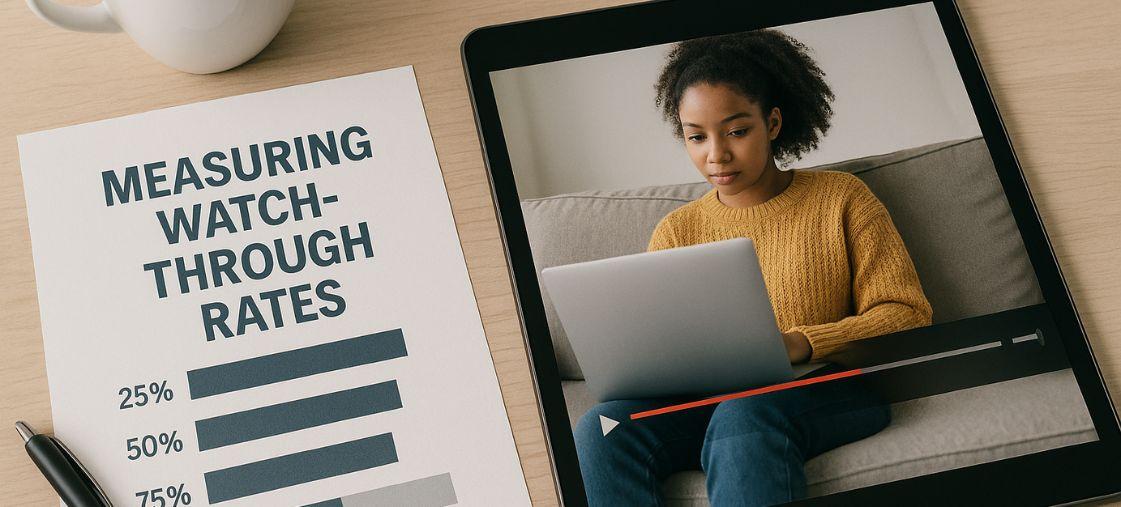
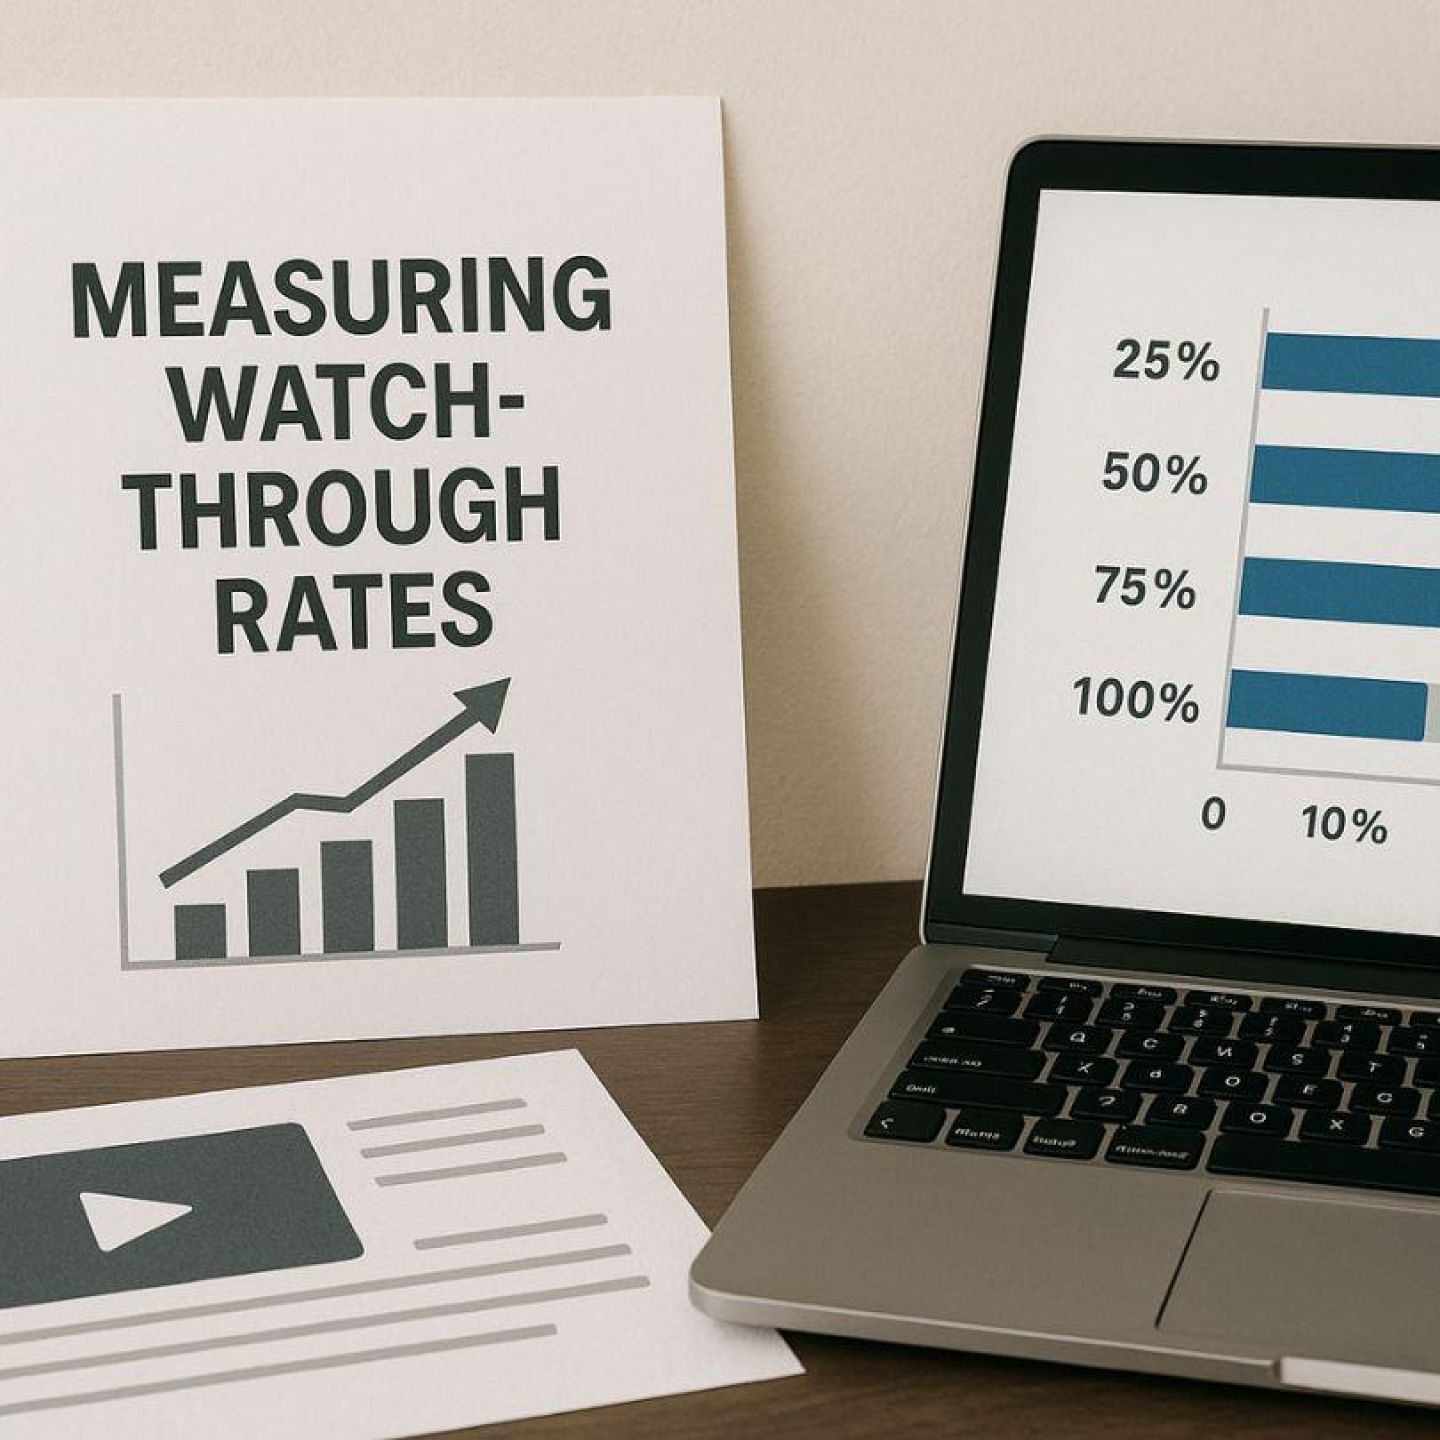
Try It FREEMeasuring watch-through rates has become the defining metric separating successful video campaigns from those that fall flat in 2025. Watch-through rate (WTR) tells you exactly what percentage of your video viewers actually watch—not just how many people clicked play and scrolled away three seconds later.
You've probably noticed the shift. Video marketing in 2025 isn't about vanity metrics anymore. Simple view counts don't tell you whether your content resonated or whether viewers stuck around long enough to absorb your message. WTR reveals the truth about your content's quality and your audience's genuine interest level.
The video marketing landscape has transformed dramatically, with platforms prioritizing engagement depth over surface-level metrics. TikTok, Instagram Reels, YouTube Shorts, and LinkedIn have all doubled down on video content, creating an environment where attention is the most valuable currency you can earn.
This article will show you why watch-through rate stands as the most critical metric for video marketing success this year and beyond. You'll discover how to measure it, optimize it, and leverage it to drive real business results.
Watch-through rate definition centers on one fundamental question: what percentage of your video did viewers actually watch? This viewer engagement metric calculates the exact portion of your content that holds attention, measured from the first second to the last.
You'll find platforms track this metric at specific checkpoints:
Video completion rates paint a dramatically different picture than simple view counts. A view count tells you someone clicked play—nothing more. That "view" might represent three seconds of accidental playback or a full watch-through with multiple replays. You can't distinguish between the two.
WTR reveals the truth about audience behavior. When you see a 75% watch-through rate, you know viewers stayed engaged through three-quarters of your content. This data exposes which segments captivate your audience and which moments trigger drop-offs. You gain actionable intelligence about content quality, pacing effectiveness, and message resonance.
The metric transforms raw numbers into behavioral insights. You understand not just if people watched, but how much they watched—and that distinction defines successful video marketing in 2025.
The rise of short-form video has transformed the digital content landscape, making watch-through rates (WTR) more important than ever. Platforms like TikTok and Instagram Reels have fundamentally changed how audiences consume video content, with TikTok surpassing 1.5 billion active users and Instagram Reels driving 20% more engagement than standard posts.
The shift toward bite-sized content has created a paradox: while videos are shorter, viewer expectations for quality and engagement have intensified. TikTok video engagement thrives on the first three seconds, where creators must immediately capture attention or risk losing viewers to the endless scroll. This compressed timeline makes every second count, transforming WTR from a nice-to-have metric into a survival indicator.
Instagram Reels metrics reveal similar patterns, with the platform's algorithm heavily favoring content that keeps viewers watching until the end. A Reel with 80% watch-through rate will consistently outperform one with millions of views but only 30% completion. This algorithmic preference has forced marketers to reconsider what "success" means.
Traditional view counts tell you how many people clicked play. They don't tell you if anyone stayed. In the short-form video era, where a "view" might count after just one second, this distinction matters tremendously. You need to know if your 15-second video held attention for 3 seconds or 14 seconds—that difference determines whether your message landed or disappeared into the void.
The InStream watch-through rate measures how much of your video advertisement viewers actually watch when it appears within other video content—whether that's before, during, or after the main video they came to see. This metric calculates the percentage of your ad that viewers consume before skipping, closing, or navigating away.
It's important to understand that InStream WTR differs significantly from standard video ad performance metrics. When you're measuring InStream ad success, you're not just counting impressions (how many times your ad appeared) or clicks (how many people interacted). You're capturing something far more valuable: genuine attention and sustained interest in your advertising message.
Here's what makes InStream watch-through rate indispensable for your 2025 campaigns:
InStream watch-through rate reveals whether your ad creative, messaging, and pacing align with viewer expectations in those critical interruption moments.
Video ad analytics extend far beyond a single metric. You need multiple data points to understand how your audience truly interacts with your content. Average watch time provides the raw seconds or minutes viewers spend with your video, giving you a baseline for engagement intensity. When you combine this with watch-through rate, you start seeing patterns that reveal content quality.
However, it's crucial to recognize that video metrics encompass a wide range of performance indicators. These metrics are essential for tech marketers aiming to measure performance, boost ROI, and optimize campaigns for maximum impact.
Retention graphs transform abstract numbers into visual stories about viewer behavior. These graphs map exactly when people stay engaged and when they abandon your content. You'll see spikes where viewers rewatch compelling moments and steep drops where interest evaporates. The power lies in identifying specific timestamps where engagement shifts.
Drop-off points expose the "dead zones" in your videos—those critical seconds where viewers decide your content isn't worth their time. You might discover that viewers leave at the 8-second mark when your product demo starts, or they exit right before your call-to-action. These insights are gold for optimization.
I've analyzed hundreds of retention graphs, and the patterns are consistent: videos with multiple drop-off points need structural changes, not just tweaks. You can pinpoint whether your hook fails, your middle section drags, or your ending lacks impact. This granular analysis separates guesswork from data-driven decisions, letting you refine every second of your video content for maximum retention.
Watch-through rate optimization demands a strategic approach to content creation from the first frame to the final second. You need to hook viewers within the first three seconds—this isn't optional anymore. Start with your most compelling visual or statement, not with introductions or logos. The opening moment determines whether viewers stay or scroll.
Content retention strategies center on maintaining momentum throughout your video. You should structure your content using the "value ladder" approach: deliver quick wins early, build anticipation for what's coming, and space out key information to prevent drop-offs. Pattern interrupts—sudden changes in visuals, music, or pacing—reset viewer attention every 7-10 seconds, particularly effective for videos exceeding 30 seconds.
Viewer engagement techniques rely heavily on analyzing your retention patterns. You'll notice specific timestamps where audiences consistently exit. These insights tell you exactly where to tighten your script, add visual interest, or restructure your message. If viewers drop at the 15-second mark, your content isn't delivering on the promise made in your hook.
Pacing matters more than production quality. You can create retention-optimized content by matching your editing rhythm to platform-specific viewing behaviors. TikTok audiences expect faster cuts than LinkedIn viewers. Test different pacing styles against your retention graphs, then double down on what keeps viewers watching. Your retention data becomes your creative roadmap, showing you precisely where to adjust messaging for maximum engagement.
Video engagement analytics 2025 has transformed how you track and interpret viewer behavior. Advanced platforms now provide granular insights that go far beyond basic view counts, giving you access to heat maps showing exactly where viewers rewind, pause, or abandon your content. You can see which frames generate the most engagement and which segments cause viewers to click away.
AI-powered video marketing tools have revolutionized the analytics landscape. These platforms automatically segment your audience based on viewing patterns, identifying which demographics watch longer and which content types perform best with specific groups. You get real-time alerts when videos underperform, allowing you to adjust your strategy immediately rather than waiting for end-of-campaign reports.
The role of performance tracking automation has become indispensable. Modern analytics tools integrate with your content management systems to automatically tag and categorize videos based on performance metrics. You can set custom benchmarks for watch-through rates and receive automated recommendations for content improvements.
AI doesn't just analyze your existing content—it actively shapes your future videos. Machine learning algorithms study your top-performing content and suggest optimal video lengths, pacing adjustments, and even ideal posting times. Some platforms now offer dynamic editing features that automatically create multiple versions of your video, each optimized for different audience segments based on their historical viewing preferences. You can test these variations simultaneously and let the AI identify which version drives the highest watch-through rates.
High watch-through rates lead to measurable business results. When viewers watch your videos all the way through, they're understanding your message, recognizing your value, and becoming familiar with your brand. This prolonged attention lays the groundwork for important brand loyalty metrics.
Research consistently shows that videos with watch-through rates above 70% generate 3 times higher brand recall compared to videos where viewers stop watching early. You're not just getting people's attention—you're leaving a lasting impression that can influence their buying decisions weeks or months later.
Brands that track customer retention alongside video engagement data have found that audiences who finish watching product videos are 45% more likely to make repeat purchases.
The link between watch-through rates and conversion rates from video marketing is also strong. Landing pages with videos that have high completion rates see conversion increases of 80-120%. When viewers stay interested in your entire message, they reach your call-to-action prepared and informed, ready to take action.
Marketing ROI measurement becomes clearer when you compare watch-through rates with sales data. E-commerce brands have reported that customers who watch product videos all the way through tend to have 35% larger average order values and 25% lower return rates. The quality of engagement—measured by watch-through rate—is a better predictor of revenue outcomes than just looking at view counts. You're building connections through sustained attention, and those connections lead to real sales results.
The future of video marketing metrics points toward increasingly sophisticated measurement systems that build upon watch-through rate foundations. You'll see platforms developing multi-dimensional engagement scores that combine WTR with emotional response tracking, eye-movement patterns, and interactive element engagement. These evolving digital marketing trends suggest that passive viewing metrics will give way to active participation measurements.
Emerging technologies are already reshaping how you measure viewer interaction:
The demand for precise engagement metrics like WTR will intensify as content saturation reaches unprecedented levels. You need granular data to differentiate your content in crowded digital spaces. Privacy-conscious measurement innovations will emerge, allowing you to gather detailed engagement insights while respecting viewer data preferences through aggregated analytics and consent-based tracking.
Augmented reality and interactive video formats will introduce new WTR variations, measuring engagement depth through user choices and participation rates rather than passive viewing duration alone.
Watch-through rate stands as the definitive metric for video marketing success in 2025. You need to integrate WTR measurement into every aspect of your digital marketing strategy—from content creation to campaign optimization. This metric reveals what view counts and impressions simply cannot: genuine audience interest and content effectiveness.
Key takeaways on WTR importance:
You should prioritize quality engagement measurement over vanity metrics. The marketers who thrive in this evolving landscape are those who understand that Measuring Watch-Through Rates: The Metric That Matters Most in 2025 isn't just about tracking numbers—it's about understanding your audience at a deeper level. Start analyzing your retention graphs today, optimize your content based on drop-off points, and watch your marketing ROI transform.
Receive top converting landing pages in your inbox every week from us.
Most Read
Award-winning advertising celebrates originality, polish, and big ideas, but TikTok's highest-spending advertisers succeed by following a very different playbook. This article explores why traditional creative instincts often fail on short-form platforms, how top performance marketers use competitive intelligence and creator-driven formats to guide creative development, and why speed, pattern recognition, and scalable content systems are replacing intuition as the foundation of modern advertising success.
Priya Kapoor
7 minJun 20, 2026
How-To
New ad surfaces like Samsung TV home screens, TikTok premium placements, and push notification networks create opportunities—but also costly learning curves. This article shows how marketers can use competitive intelligence and ad spying techniques to study early adopters, uncover winning strategies, and reduce risk before investing in emerging advertising channels.
Samantha Reed
7 minJun 17, 2026
Featured
This article explores why TikTok virality is not random luck but the result of identifiable structural patterns that can be studied, measured, and replicated before a campaign launches. It explains how the artificial divide between organic social teams and paid media teams prevents marketers from recognizing that the same hooks, pacing, emotional triggers, and engagement mechanics drive success across both organic content and paid ads. The article also highlights how advertisers can use competitive intelligence tools and TikTok ad research to reverse-engineer winning creative structures, build data-driven creative briefs, and create faster feedback loops that turn platform signals into scalable advertising performance.
David Kim
7 minJun 7, 2026


