
7 minAugust 19, 2026

Our spy tools monitor millions of TikTok ads from over 55+ countries. Biggest TikTok Ad Library in E-commerce and Mobile Apps!
Try It FREEEvery dropshipper remembers the moment they first saw the Medicube PDRN balm flooding their For You Page. Creators were slathering it on, filming skin transformations, racking up millions of views. The comments sections buzzed with "link?" and "where do I buy this?" It looked, by every visible metric, like the perfect product to launch. And that instinct — to treat a surge in organic views, shares, and trending sounds as a green light — is exactly the trap that bleeds most newcomers dry.
Here's the timeline nobody talks about. Weeks before that balm became an organic sensation, well-capitalized advertisers had already identified early demand signals through paid ad testing. They'd locked in supplier agreements, negotiated shipping terms, and begun running in-feed ads that look nearly identical to organic content — quietly seeding the product into the algorithm's recommendation engine. The organic virality that followed wasn't the starting gun. It was the echo. By the time the hashtag hit critical mass and social listening dashboards lit up, those sophisticated operators had already saturated the ad auction, driven cost-per-acquisition skyward, and compressed margins to a point where late entrants were essentially paying a premium to compete for scraps.
The fundamental error is a category mistake about metrics. Most dropshippers track what Semrush's social media framework defines as amplification rate — shares per post relative to total followers — and virality rate — shares divided by impressions. These are useful indicators of how far content travels beyond its original audience. But they are distribution metrics, not demand-formation metrics. They tell you that a product is being talked about. They do not tell you whether the commercial window is still open. The distinction is critical: amplification rate measures how enthusiastically an audience is passing content along, while the underlying buying opportunity may have already peaked days earlier.
The speed at which that window closes is staggering. Silverpush's analysis of more than 80 TikTok campaigns across nine APAC markets found that trends typically peak within 48 to 72 hours. Most social listening tools, by design, measure volume after a spike. By the time a topic becomes visible through volume analysis, the exposure — and the opportunity — has already crested. Think about what that means operationally: even if you spot a trending product on Monday morning, source a supplier by Tuesday, and launch your store by Wednesday night, you're arriving at a party that's already winding down.
This compressed lifecycle reframes the entire relationship between virality and opportunity. Organic virality isn't a green light signaling "go." It's a closing bell signaling that the demand cycle has already been captured, monetized, and is now dissipating into noise. The views are real. The shares are real. The buying intent was real — 72 hours ago, when the first wave of paid ads seeded the algorithm and the earliest movers locked up the economics.
The dropshippers who consistently win aren't reading the same signals everyone else reads. They aren't refreshing trending pages or chasing hashtag volume. They've learned to look upstream — at the paid-side mechanics, the ad library patterns, the supply chain indicators that precede the viral moment. The rest of this article will show you exactly where those signals live and how to read them before the crowd arrives.
If organic virality is the lagging indicator most dropshippers mistake for a signal, then ad spend momentum is the leading one they almost universally ignore. The pattern is consistent: weeks before a product category explodes across the For You Page, a cluster of early-mover brands and sophisticated DTC operators begin scaling paid TikTok campaigns around it. They are not reacting to virality. They are engineering the conditions for it, and the traces they leave behind in ad intelligence tools are readable if you know what to look for.
The mechanics are straightforward once you understand the sequence. A product with emerging demand — say, a PDRN-infused skincare balm or a portable massage gun with a new angle — first appears as a handful of new creatives from two or three advertisers testing the waters. Within days, you see the telltale acceleration: more advertisers entering the same product category, increasing ad frequency per advertiser, expanding geo-targeting from a single market to multiple English-speaking regions, and rising estimated daily spend. This clustering of paid activity is the demand signal. The organic virality that follows — the avalanche of creator videos, the comment sections full of "where do I buy this?" — is just the exhaust from a combustion that paid media already ignited.
What makes this signal so reliable in 2026 is that TikTok itself has built the infrastructure to reward exactly this kind of paid-first strategy. The platform's 2026 NewFronts presentation introduced a suite of premium ad formats — Logo Takeover, Prime Time, TopReach, and expanded Pulse offerings — explicitly designed to give advertisers dominant positioning at every stage of the funnel. Logo Takeover places a brand at the moment of app open, before any organic content competes for attention, and early tests showed double-digit lifts in both brand awareness and purchase intent. Prime Time delivers up to three sequential ads from the same brand within a fifteen-minute window, a storytelling capability that used to belong exclusively to television. These are not experimental placements for brand awareness experiments. They are commerce-oriented tools built for advertisers who want to own a product moment before it becomes a cultural one.
The scale of the opportunity reinforces why sophisticated operators are leading with paid. TikTok generated $33.1 billion in global advertising revenue in 2025, a 43 percent increase year over year, and its engagement rate of 3.7 percent remains nearly eight times higher than Instagram's. Meanwhile, research from TikTok Marketing Science shows that users are 1.5 times more likely to purchase a product they discover on TikTok than on other platforms, with discovery and conversion often happening in the same session. That compressed path from ad exposure to purchase is precisely why paid spend clusters so aggressively around emerging product categories — the return on that early spend is measurable almost immediately.
So when you open an ad intelligence tool and see five new advertisers suddenly running creatives for the same product type, using commerce-oriented placements and scaling spend daily, you are not looking at confirmation of a trend. You are looking at the trend's origin point. Those advertisers are betting real money on a demand curve they have identified through supplier data, search volume shifts, or creator outreach pipelines — signals that precede anything visible on the organic surface by two to four weeks. By the time the For You Page catches up and the product "goes viral," the early movers have already locked in supplier relationships, tested winning creatives, and built retargeting audiences. The dropshippers who arrive after the organic wave crests are competing for scraps at inflated CPMs, fighting over the same saturated audience, and wondering why a product that looked like a sure thing is producing razor-thin margins. The signal was there. They were just reading the wrong dashboard.
Most dropshippers treat ad spy tools like accounting software — they pull spend data, sort by highest daily budget, and assume the products burning the most cash are the ones worth copying. But raw spend figures tell you almost nothing about where a product sits in its lifecycle, and lifecycle positioning is what determines whether there's margin left to capture. The real signal isn't how much is being spent. It's what the ads themselves look like.
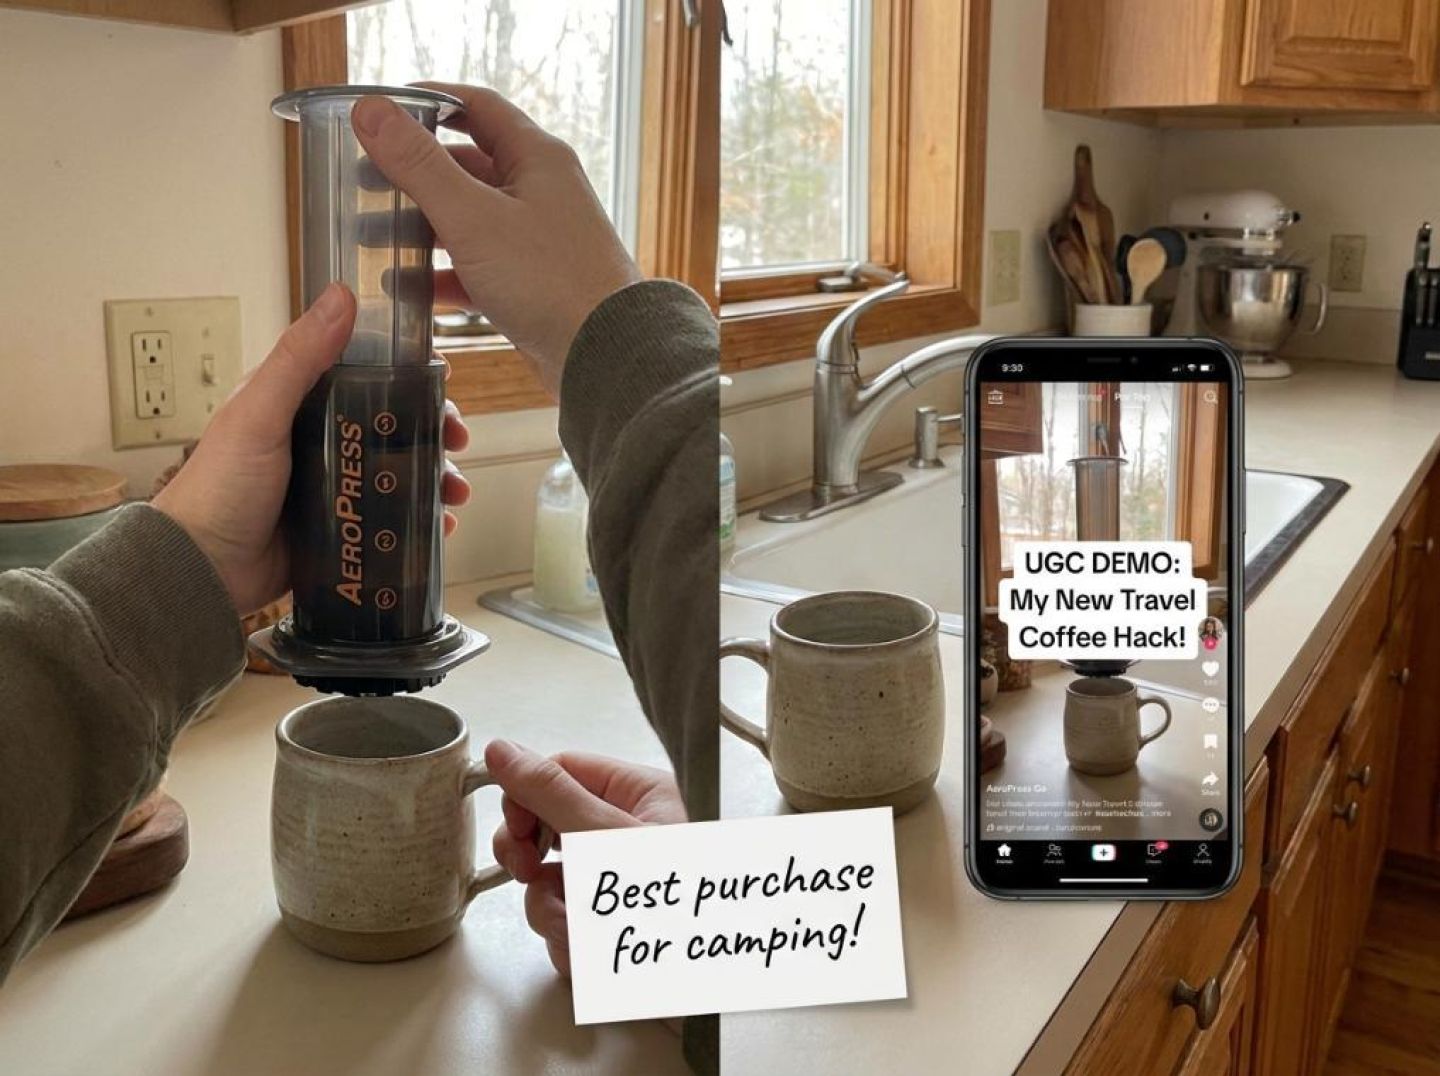
Think of ad creative as a biological clock for product profitability. Every winning product follows a predictable creative evolution, and learning to read that evolution gives you a timing advantage that spend data alone never will. In the early stage — when margins are fattest and competition thinnest — the ad ecosystem around a product is dominated by raw, unpolished, demonstration-heavy UGC. These are creators filming themselves using the product in real environments, showing genuine before-and-after results, explaining in their own words why something works. The content is messy, handheld, and authentically enthusiastic. That's not an accident. It's what performs.
Research from Billion Dollar Boy and DAIVID's emotion-tracking analysis of 5,000 creator-led assets found that demonstration-based content outperformed declarative messaging by 33% in brand favorability and 15% in consideration. Showing the product in actual use — the real result, the creator's honest reaction — beats "this product is amazing" messaging by a wide margin. The same research revealed that assets leading with product, benefit, or brand messaging in the opening seconds saw view rates collapse by 44% and consideration plummet by 41% compared to content that built a hook first and let the brand arrive as the payoff. Early-stage products haven't yet attracted the brand teams who make that mistake. Their ad ecosystems are still populated by creators who instinctively understand the hook-first, proof-driven format that actually converts.
This is why user-generated content consistently outperforms highly polished advertisements on TikTok, as WordStream emphasizes — it feels more casual, more authentic, and more trustworthy. Customer testimonials, unboxing videos, before-and-after transformations: these are the signatures of a product still in its ascent phase. When you're scanning a product's ad library and every creative looks like it was filmed on someone's bathroom counter with natural lighting and genuine excitement, you're looking at early-stage signal. The margins haven't been compressed yet because the competitive field hasn't arrived in force.
Now contrast that with what happens twelve to sixteen weeks later. The same product's ad library starts filling with studio-lit content, professional voiceovers, claim-heavy copy ("clinically proven," "dermatologist recommended"), and occasionally celebrity or macro-influencer endorsements. The messaging shifts from "watch what happens when I use this" to "this is the number-one product for X." That transition isn't just a creative preference — it's a financial autobiography. Polished brand content enters when customer acquisition costs have risen enough to require the perceived authority of production value to maintain conversion rates. The informed money — the operators who entered during the UGC phase — has already extracted the widest margins. What you're seeing now is the defense phase, not the growth phase.
The practical application is straightforward: before you source a product, audit the creative mix across every advertiser running it. If the landscape is still dominated by authentic, demonstration-led, creator-shot content with hook-first structures, you're likely looking at an early-to-mid lifecycle product with real margin runway. If it's shifted predominantly toward polished brand assets and declarative claims, you're late. The creative mix isn't decoration. It's the lifecycle clock, and it's always ticking.
The fundamental problem with most dropshippers' product research isn't laziness — it's that they're borrowing measurement frameworks designed for an entirely different game. Brand managers track engagement rate, follower growth, and sentiment because they're building equity over quarters and years. Product arbitrage operators need to time a window that opens and closes in days. Using the same dashboard for both is like navigating a sprint with a marathon pace chart.
To build a signal dashboard that actually serves product timing, you need to separate rate-of-change indicators from absolute volume indicators — and then weight them correctly. The distinction Semrush draws between compounding metrics and churning metrics maps directly onto this problem. Amplification rate (shares per post relative to total followers) and virality rate (shares divided by impressions) tell you whether content about a product is accelerating outward or merely circulating among an existing audience. If both are climbing for a product category while advertiser density remains low, you have runway. If raw social volume is high but those rates have plateaued or declined, you're watching the tail end of a wave, not the front.
Here's a practical scoring framework you can implement in a simple spreadsheet:
Track these five signals daily for any product on your watchlist:
Ignore these: Total view count, total likes, follower count of the creator who posted it, and trending hashtag volume. These are lagging indicators that tell you what already happened, not what's about to.
The reason volume-based social listening consistently fails for product timing is the same reason it fails for brand safety — as SilverPush's analysis of over 80 TikTok campaigns found, trends typically peak within 48 to 72 hours, meaning that by the time a topic crosses a volume threshold large enough to register in most monitoring tools, the actionable window has already closed. The same compressed timeline that makes TikTok dangerous for brand safety makes it punishing for dropshippers who rely on volume spikes as their entry signal.
Run this scoring system daily. Products scoring above 70 out of 100 with accelerating trajectories across the top three weighted signals deserve immediate sourcing investigation. Products scoring high on volume-based metrics but flat on rate-of-change indicators deserve exactly one thing: a hard pass.
When a product crosses your feed with unmistakable momentum — surging views, a flood of creator content, comment sections full of purchase intent — the instinct is to move immediately. Resist it for exactly 48 hours. That window is long enough to separate real opportunity from the tail end of a wave you've already missed, and short enough to preserve your first-mover advantage if the signal holds up. Here's the process, step by step.
Step 1: Check paid activity history. Before you evaluate the product itself, evaluate who's already spending money on it. Pull the product into an ad intelligence platform — Minea, PiPiADS, or the TikTok Ad Library — and sort by launch date of the earliest creative. If the first ads appeared more than 10 to 14 days ago and multiple advertisers are already running, you're not early. You're arriving at peak saturation. What you want to see is a small cluster of advertisers with campaigns launched within the last three to seven days, which suggests the paid discovery phase is still young.
Step 2: Assess creative maturity and format distribution. Look at the actual ad creatives running. Are they raw, creator-shot clips with minimal editing, or have they evolved into polished studio productions with branded overlays and professional voiceovers? Research analyzed by Search Engine Journal found that assets leading with product or brand messaging in the opening seconds saw view rates drop by 44 percent compared to content that built a hook first. If most ads for the product have already shifted to that polished, brand-first format, the creative lifecycle is mature — meaning the best-performing angles have already been exploited and your cost to compete on creative quality just went up significantly.
Step 3: Evaluate advertiser density and new entrant velocity. Count how many distinct advertisers are running paid campaigns for this exact product or obvious clones. Then check again 24 hours later. If the number jumped by more than 30 percent in a single day, you're watching a land rush — and land rushes compress the margin window violently. Three to five advertisers with stable day-over-day growth is manageable. Fifteen advertisers with five new entrants overnight is a product you should walk away from.
Step 4: Estimate the remaining margin window. Cross-reference the lifecycle indicators from Steps 1 through 3 against the product's unit economics. With TikTok's engagement rate sitting at 3.7 percent — nearly eight times higher than Instagram and twenty-five times higher than Facebook — early-stage products can generate outsized organic reach that subsidizes your paid spend. But that organic subsidy disappears as the feed floods with competing content. Calculate your all-in cost (product, shipping, ad spend, returns) and your realistic selling price. If your margin only works at a cost-per-acquisition below $12, and current advertiser density suggests CPAs will climb past that within a week, the window is already closing.
Step 5: Make the go/no-go decision using concrete thresholds. Green light the product only if all four conditions are met: paid activity is under 10 days old, fewer than eight total advertisers are running, new entrant velocity is below 30 percent daily growth, and your projected margin holds at a CPA 40 percent above current levels (your buffer for inevitable cost inflation). If even one condition fails, pass. As Marketing Dive's reporting on TikTok Shop makes clear, brands that succeed on the platform move quickly but arrive prepared — they don't chase virality blindly, they position for it structurally.
This entire audit should take no more than two focused hours spread across two days. The discipline isn't complicated. The hard part is walking away from products that feel exciting but fail the framework — and that discipline is exactly what separates operators who compound profits from those who perpetually chase the last wave.
Receive top converting landing pages in your inbox every week from us.
Guide
Most dropshippers treat TikTok virality as a buying signal when it is often already a late-stage indicator. This article explains how to look upstream at paid ad activity, advertiser entry, creative maturity, spend acceleration, and rate-of-change metrics to identify product opportunities earlier. It provides a practical scoring system and 48-hour audit to help dropshippers decide whether a viral product still has enough margin and market runway before entering.
Priya Kapoor
7 minAug 19, 2026
Guide
TikTok's booming sports creator ecosystem is creating new opportunities for dropshippers who know where to look. By tracking creator-led product demonstrations alongside competitor ads, sellers can identify emerging products before they become saturated. Combining organic creator trends with ad intelligence enables faster product validation, stronger creatives, and better margins in fast-moving sports niches.
Liam O’Connor
7 minAug 5, 2026
In-Depth
Performance marketers are winning bigger marketing budgets because they can prove ROI quickly, communicate in financial metrics executives trust, and leverage competitive intelligence to make smarter investment decisions. As brand teams struggle with attribution and internal influence, data-driven performance marketing continues to gain organizational advantage.
Liam O’Connor
7 minJul 23, 2026









)