7 minNovember 4, 2026

Our spy tools monitor millions of native ads from over 60+ countries and thousands of publishers.
Get StartedReturn on ad spend is one of the most familiar numbers in performance marketing. It tells advertisers how much revenue a campaign generates relative to its advertising cost. But it does not explain everything happening around that campaign.
A healthy ROAS can hide rising competitive pressure. A declining return may reflect a new competitor entering an auction rather than a sudden problem with your creative. A campaign that appears average in last-click reporting may still introduce new customers or reveal a valuable audience opportunity.
This is where competitive ad intelligence becomes important.
By studying competitor advertisements, keywords, placements, landing pages, and visible campaign patterns, marketers can understand more than their own immediate results. They can identify changes in the market, develop new hypotheses, and learn from experiments other advertisers have already funded.
The challenge is measuring the value of that learning.
Strategic imitation is not simply copying another advertiser's creative and hoping for the same results. It is a disciplined process of observing competitive signals, adapting useful ideas, testing them in your own environment, and measuring whether those decisions improve your business.
This guide introduces a practical framework for measuring that process. It looks beyond ROAS to include relative efficiency, information gained, customer acquisition quality, and the value of building a more informed advertising strategy.
ROAS is attractive because it appears definitive.
You spend a certain amount, generate a certain amount of revenue, and calculate the return. The number can help determine whether a campaign is meeting its immediate financial objective.
But once competitors enter the picture, ROAS becomes an incomplete view of performance.
It tells you what happened inside your own reporting environment. It does not necessarily explain why your results changed, whether your efficiency is competitive, or what other advertisers are learning while you optimize your campaigns.
Imagine your CPC begins increasing while your impression share declines.
Your ROAS dashboard may eventually show that acquisition has become more expensive. But it may not tell you whether:
These possibilities require different responses.
Semrush's Advertising Toolkit and its discussion of competitor ad spend analysis illustrate how auction-related information can help advertisers investigate changes in their competitive environment.
Google Auction Insights can also provide useful information about overlapping advertisers and impression-share relationships in eligible search campaigns.
The important distinction is that ROAS describes your return, while competitive analysis helps investigate the conditions influencing that return.
Newer advertising products may provide campaign-level reporting without offering the same competitive diagnostics available in more established advertising platforms.
The original draft references early coverage of ChatGPT Ads by Search Engine Journal, describing limitations around Auction Insights, impression share, and cross-advertiser benchmarks.
When advertisers cannot see comparable competitive information, interpreting changes in CPC, CPA, or ROAS becomes more difficult.
A rising CPC could reflect stronger competition, changes in the conversations or placements where ads appear, or differences in relevance and delivery. Without sufficient reporting, marketers may not be able to isolate the cause.
That is why competitor research becomes especially useful in environments where native reporting provides limited visibility.
A competitor may change its creative strategy, diversify its placements, or shift its budget toward a more favorable audience.
Those decisions may not immediately affect your own revenue.
However, repeated changes in visible campaign activity, share of voice, and available auction signals can provide clues about how the competitive environment is evolving.
AdExchanger's analysis of competitive auction signals, including its discussion of Polaris AI and the insurance category, describes how competitive intelligence can reveal differences between simply spending more and potentially buying media more efficiently.
These signals can help generate hypotheses about competitor strategy. They should not be treated as proof of another advertiser's actual acquisition costs or profitability unless those figures are independently established.
Your ROAS might remain stable while a competitor is improving its own system. Waiting until your results deteriorate before investigating the market means reacting after an advantage may already have developed.
Competitive conquesting provides another example.
Bidding directly on a competitor's brand name can be expensive and may attract people who already have a strong preference for that brand.
A different strategy is to investigate category-level and comparison-intent searches.
Someone searching for a product category, an alternative, or a comparison may be evaluating several options rather than looking for one specific brand.
WordStream's competitive conquesting guidance discusses approaches that go beyond straightforward competitor-brand bidding.
The original draft also cites a test reporting an 8% higher ROAS and 7% lower CPA after adding comparison keywords. Those specific figures should be treated as case-study results, not universal benchmarks.
The strategic lesson is that a campaign's value can depend on the intent it captures, not just the total return shown in an account-level report.
Retail media creates a similar challenge.
A campaign may influence product discovery and purchase consideration without receiving direct credit for every eventual sale. In-store advertising may reach shoppers who were already visiting a store, making attributed sales alone an incomplete measure of incremental contribution.
Adweek's discussion of retail media as a brand-building channel highlights the need to consider outcomes beyond immediate attributed ROAS.
Matched-market experiments and other suitable measurement approaches can help estimate whether retail media generates additional sales compared with a relevant control.
The broader principle applies across search, social, retail, and emerging advertising environments:
ROAS tells you what your campaigns returned. Competitive intelligence helps you understand the market conditions, strategic decisions, and learning opportunities behind those returns.
To measure the full value of competitive ad spying, marketers need to examine both.
Strategic imitation is not about copying a competitor's advertisement and assuming its success will transfer to your business.
It is about identifying useful competitive signals, understanding the decisions behind visible campaign patterns, adapting relevant ideas, and measuring the impact of those actions.
That requires a broader definition of return on investment.
Traditional advertising metrics such as CTR, conversion rate, CPA, and ROAS describe how efficiently a campaign turns impressions into actions. They remain important, but they do not measure every benefit of competitive research.
Strategic Imitation ROI asks whether the intelligence changed your decisions and improved your ability to compete.
Collecting competitor advertisements, keywords, and landing pages has little value if your team never uses the findings.
The first question is whether competitive signals led to a concrete decision.
For example:
A spy tool becomes strategically useful when its observations lead to actions that can be tested.
Revenue can increase while your business continues to overpay for media compared with other advertisers.
Strategic imitation should therefore examine efficiency alongside absolute performance.
Depending on the available data, useful comparisons may include:
The objective is not to assume that you can see every competitor's actual results. It is to understand whether your own advertising system is becoming more efficient and whether the competitive gap appears to be narrowing.
A test can be strategically valuable even when it does not immediately become a winning campaign.
Suppose a competitor repeatedly uses comparison-focused native advertising. You adapt the structure for your product and discover that it attracts a different type of prospect.
Even if the test does not produce the lowest CPA, it may reveal a new customer intent, a stronger landing-page structure, or an audience worth investigating.
That knowledge can inform future campaign decisions.
Competitive intelligence is therefore valuable not only for the campaigns it improves today, but also for the hypotheses it creates for tomorrow.
Competitor research can also help identify approaches that may not deserve immediate investment.
If a competitor experiments with a new format and later appears to reduce its activity, that observation may justify further investigation before you commit a large budget.
However, disappearance from an advertising database does not prove that a campaign failed. The advertiser may have changed networks, targeting, creative, or campaign objectives.
Treat these observations as warning signals rather than verified financial outcomes.
The value comes from using market evidence to make more cautious decisions, not from assuming you know exactly why another advertiser changed direction.
Strategic imitation should not stop at auction efficiency.
A competitor's advertising may reveal a more useful way to manage frequency, present product information, address objections, or guide visitors through a landing page.
Adopting a better approach may improve the experience even when the immediate ROAS difference is small.
Possible indicators include:
These results should be measured using your own campaign and customer data. A visible competitor pattern alone cannot establish that its customer experience is superior.
Strategic Imitation ROI is the combined value created by using competitor intelligence to improve advertising decisions, discover new opportunities, reduce avoidable waste, and strengthen future campaign performance.
It can be evaluated through four dimensions:
This framework does not replace ROAS. It gives ROAS a wider strategic context.
Competitive spying becomes a deliberate business practice when the information collected leads to better decisions, measurable experiments, and accumulated knowledge.
Most advertisers spend considerable time reviewing their own dashboards.
They monitor ROAS, CPA, CTR, conversion rates, and perhaps impression share. Those metrics are important, but they only show part of the competitive environment.
Other signals can help explain what competitors are testing, where they are appearing, and how their advertising strategies may be changing.
Four categories deserve particular attention.
When CPC increases or impression share declines, it is tempting to blame the algorithm and move on.
But the market may have changed.
Using available Auction Insights and competitor advertising research, investigate whether the movement coincides with:
Each possibility suggests a different response.
If competition has increased, you may need to reconsider your bidding strategy. If demand has shifted, you may need to explore new intent categories. If your own creative or landing page is underperforming, the solution may be an internal optimization rather than a budget increase.
Semrush's competitor advertising analysis is useful context for understanding why competitive data can help explain performance changes that account-level ROAS cannot diagnose on its own.
Another important signal is how quickly advertisers appear to be changing their creative and campaign approaches.
A competitor's visible advertising activity may reveal:
The original draft references AdStellar and HubSpot's discussion of its creative management capabilities, including a feature described as a Winners Hub.
Tools that help advertisers organize creative performance can accelerate internal testing and iteration. Competitor research can help you monitor the visible output of that process.
For example, a brand may move from a general money-saving message to more specific themes around convenience, risk reduction, or product comparisons.
That change may indicate a new creative hypothesis or a repositioning effort. It does not reveal the competitor's internal test results, but it gives you a reason to investigate the underlying message.
Competitor conquesting is often approached as a simple question: should you bid on another brand's name?
But direct competitor-brand searches are only one part of the opportunity.
Comparison and category-level searches may reveal people who are actively evaluating alternatives.
Examples include:
WordStream's competitive conquesting guidance discusses why comparison and non-brand conquesting can be worth investigating alongside direct brand targeting.
Watch for competitor activity around these terms and organize the findings by intent.
A shift toward comparison searches may suggest that an advertiser wants to participate earlier in the evaluation process. It may also reveal which alternatives or customer segments the brand considers strategically important.
Do not copy the keyword without understanding the intent behind it. A comparison query needs an advertisement and landing page that genuinely help the visitor evaluate options.
As advertising moves into more automated environments, some familiar competitive reporting may be unavailable.
The original draft references early Search Engine Journal coverage of ChatGPT Ads and the reported absence of conventional Auction Insights and impression-share diagnostics.
When competitive reporting is limited, marketers may struggle to determine why CPCs or CPAs change.
Possible explanations include:
Without sufficient diagnostic data, it is difficult to isolate the cause.
This is why marketers should combine the reporting they can access with external research, structured testing, and careful documentation.
A useful research process does not stop at collecting signals. It translates them into questions that can guide action.
| Signal | Strategic question |
|---|---|
| Rising CPC | Has competition increased, or has our own relevance changed? |
| Falling impression share | Which advertisers are becoming more visible? |
| New creative variations | What customer problem or message are competitors exploring? |
| New comparison keywords | Which purchase decisions are becoming more competitive? |
| New landing-page format | What conversion barrier might this structure address? |
| Placement changes | Is the advertiser exploring a different audience or context? |
Your performance data is one half of the story. The other half is the market around it.
The more systematically you examine that environment, the more useful your competitive research becomes.
If you study only competitor advertisements, you may misunderstand why a particular campaign appears effective.
An advertisement is rarely an isolated asset. It is often part of a larger content and conversion system.
A search ad may lead to a comparison page. A social advertisement may introduce a product through creator content. A visitor may then receive educational emails, see retargeting messages, or encounter a different offer later.
Strategic imitation becomes more useful when marketers study those connected experiences rather than collecting individual advertisements.
Think about a competitor's ecosystem in three layers:
Your task is to map the visible parts of all three.
Treat every competitor advertisement as a starting point for further research.
Click through and document:
Landing-page type
Is the advertisement leading to a product detail page, comparison table, quiz, long-form sales page, advertorial, or educational article?
Additional calls to action
Does the page offer a newsletter, downloadable guide, product demo, free trial, consultation, or other secondary action?
Navigation clues
What information is emphasized in the header and footer? Pricing, case studies, resources, product comparisons, and customer stories can reveal how the company supports purchase decisions.
Message continuity
Does the landing page repeat the promise made in the advertisement? Does it introduce additional proof, explain the offer, or address objections?
Record the journey as a sequence rather than a collection of unrelated screenshots.
For example:
These sequences become useful references when planning your own funnels.
Next, investigate how the visible elements may fit together.
Search and content
If a competitor is appearing more frequently in paid search, examine the pages it promotes and the relevant organic content around its category.
Look for comparison articles, pricing pages, alternative pages, and educational guides.
Ask whether the advertiser provides information for the questions prospects ask throughout the decision process:
Social and owned media
Review the brand's visible organic and paid social activity.
Are similar themes appearing across both? Does the brand repeatedly promote a particular customer story, product demonstration, or educational message?
Repeated themes may indicate an important part of its positioning, although the exact relationship between organic and paid distribution may not be visible.
Retail media and brand building
For e-commerce and consumer brands, examine how retail media placements relate to broader campaigns.
Do product messages, promotional offers, and visual themes match what appears in search, social, video, and email?
Adweek's discussion of retail media as a brand-building channel provides context for why these placements may contribute to more than immediate attributed sales.
You cannot access a competitor's private CRM or marketing automation system simply by studying its public campaigns.
However, you can investigate some of its visible follow-up experiences.
Look for micro-conversions such as:
These offers can reveal how a company encourages prospects to take smaller steps before making a purchase.
You can also review a publicly accessible follow-up journey where appropriate.
If you choose to subscribe to a competitor's newsletter or request information, use a legitimate business research process and a separate research address. Do not misrepresent your identity, access private systems, or bypass restrictions.
Record the messages you actually receive:
These observations can help you understand the visible nurture experience, but they do not reveal the complete automation logic or targeting rules.
Most competitor research focuses on visible creative elements.
But an advertisement may be supported by a much deeper content system.
Create a simple scoring framework for each competitor and major offer.
| Dimension | Score | What to assess |
|---|---|---|
| Channel breadth | 0–5 | How many distinct discovery channels are visible? |
| Content depth | 0–5 | How many stages of the customer journey have relevant content? |
| Path coherence | 0–5 | Do the ad, landing page, and visible follow-up messages tell a consistent story? |
| Measurement visibility | 0–5 | How much evidence is available about the campaign's outcomes and measurement approach? |
The fourth dimension is deliberately measurement visibility rather than an assumption about how much the competitor relies on ROAS. An external observer usually cannot know the advertiser's internal measurement priorities.
Use the scores to organize your observations, not to claim that one competitor has a better business simply because its public content appears more complete.
Before imitating an advertisement, ask:
That is how competitive research moves beyond copying the surface of an advertisement and toward understanding the system around it.
Strategic imitation needs a measurement framework that goes beyond the usual campaign report.
A useful way to organize the evaluation is through three layers:
These layers should be measured separately before being combined into a broader business assessment.
You still need to measure ROAS and CPA.
But instead of judging an imitation-inspired advertisement in isolation, compare it with a suitable baseline.
Imitated-Variant ROAS (IV-ROAS)
This metric records the ROAS generated by your imitation-inspired variant.
[
IV\text{-}ROAS = \frac{\text{Revenue from imitation-inspired variant}}{\text{Ad spend on that variant}}
]
Compare it with your control campaign or a comparable baseline.
The original draft proposed dividing your ROAS by an estimated competitor ROAS proxy. That comparison is not reliable unless the competitor's revenue and cost data are genuinely available and measured on a comparable basis. Visible CPM, CTR, or estimated spend cannot establish competitor ROAS.
Use your own control as the primary comparison.
Relative CPA improvement
This measures how much your CPA changed after introducing the adapted creative or funnel.
[
rCPA\Delta =
\frac{\text{Baseline CPA} - \text{Test CPA}}
{\text{Baseline CPA}}
\times 100
]
A positive result indicates a lower CPA in the test.
For example, if baseline CPA is ₱1,000 and test CPA is ₱850:
[
rCPA\Delta = 15%
]
This means the test produced a 15% lower CPA than the baseline during the measured period.
It does not automatically establish that imitation caused the improvement. Campaign conditions should be comparable, and other changes should be accounted for.
Spend efficiency comparison
Track ROAS and CPA separately rather than subtracting their percentage changes into a single score.
They measure different relationships, and combining them through a simple subtraction can create a misleading result.
A practical efficiency scorecard should report:
This makes it easier to see whether a campaign is improving revenue efficiency without sacrificing lead or customer quality.
The value of strategic imitation is not limited to campaigns that immediately outperform the control.
Some experiments reveal new competitive information, identify an audience opportunity, or decisively reject a tactic that does not transfer to your business.
Auction Clarity Index (ACI)
The original draft proposes a simple 0–5 score based on the amount of useful competitive information revealed by a test.
You can retain that as an internal research score:
The score is a structured assessment of research usefulness. It is not an objective financial return and should not be presented as one.
The original draft also proposes:
[
\text{Imitation Signal ROI} =
\frac{ACI \times \text{Expected Future Budget Impact}}
{\text{Test Cost}}
]
This can be used as an internal prioritization heuristic, but the ACI is an ordinal score, not a monetary value. Multiplying it by budget impact does not produce a validated ROI measurement.
A better practice is to record the expected budget decision separately, then document whether the research actually changed that decision.
Hypothesis Hit Rate
Track how often an imitation-based hypothesis produces a clear result.
[
\text{Hypothesis Hit Rate} =
\frac{\text{Confirmed or decisively rejected hypotheses}}
{\text{Total completed imitation tests}}
\times 100
]
For example, if eight completed tests produce six clear findings:
[
\text{Hypothesis Hit Rate} = 75%
]
A decisive failure can still be useful. If the evidence shows that a competitor's approach does not fit your audience, the team has learned something worth retaining.
Do not count incomplete or inconclusive tests as confirmed findings.
Last-click reporting often gives more visible credit to channels that capture existing intent than to campaigns that introduce a brand or influence earlier decisions.
For that reason, strategic imitation can include a longer-term measurement layer.
Brand Search Lift
Track whether branded search activity changes during an imitation-inspired campaign.
[
\text{Branded Search Lift} =
\frac{\text{Campaign-period branded searches} -
\text{Baseline branded searches}}
{\text{Baseline branded searches}}
\times 100
]
Compare the campaign period with a suitable baseline and consider seasonality, other marketing activity, and changes in overall demand.
An increase may be a useful signal, but it does not prove the campaign caused the increase without stronger experimental evidence.
New-to-File Rate
Measure the proportion of customers acquired through the test funnel who are genuinely new to your customer database.
[
NTF\ Rate =
\frac{\text{New customers from the test funnel}}
{\text{Total customers from the test funnel}}
\times 100
]
Compare this with your standard funnel.
A higher new-to-file rate may indicate that the adapted structure is reaching more people who were not already customers. It should still be considered alongside acquisition cost, customer quality, and longer-term value.
Strategic Imitation ROI
The original draft proposes a blended metric:
[
S\text{-}I\ ROI =
\frac{\text{Incremental Profit} + \text{Projected Equity Value}}
{\text{Total Imitation Program Cost}}
]
This can serve as a conceptual framework, but projected equity value must be estimated carefully.
Brand search volume is not automatically financial value. New-to-file customers are not automatically incremental customers. A customer who is new to your database may still have purchased without the campaign.
For a defensible calculation:
Rather than relying on one blended number, use a scorecard that keeps the evidence visible.
| Measurement layer | Core metrics | What it tells you |
|---|---|---|
| Efficiency | ROAS, CPA, CVR, incremental profit | Whether the adapted campaign improves economics |
| Signal gain | ACI, hypothesis hit rate, new opportunities identified | Whether research improves future decisions |
| Equity shift | Branded search, new-to-file rate, customer value | Whether the campaign may contribute to longer-term demand |
| Program cost | Research, production, media, analytics, staff time | What the overall process costs |
The purpose is not to create a new metric that looks more impressive than ROAS.
It is to move the conversation from “Did this copied advertisement make money?” to “Did this competitive research improve our advertising system enough to justify repeating the process?”
Anstrex is most useful when research follows a clear objective.
Scrolling through advertisements, sorting by traffic indicators, and saving a few interesting examples can help with discovery. But without a structured process, the team may end up with a large collection of ads and very little actionable learning.
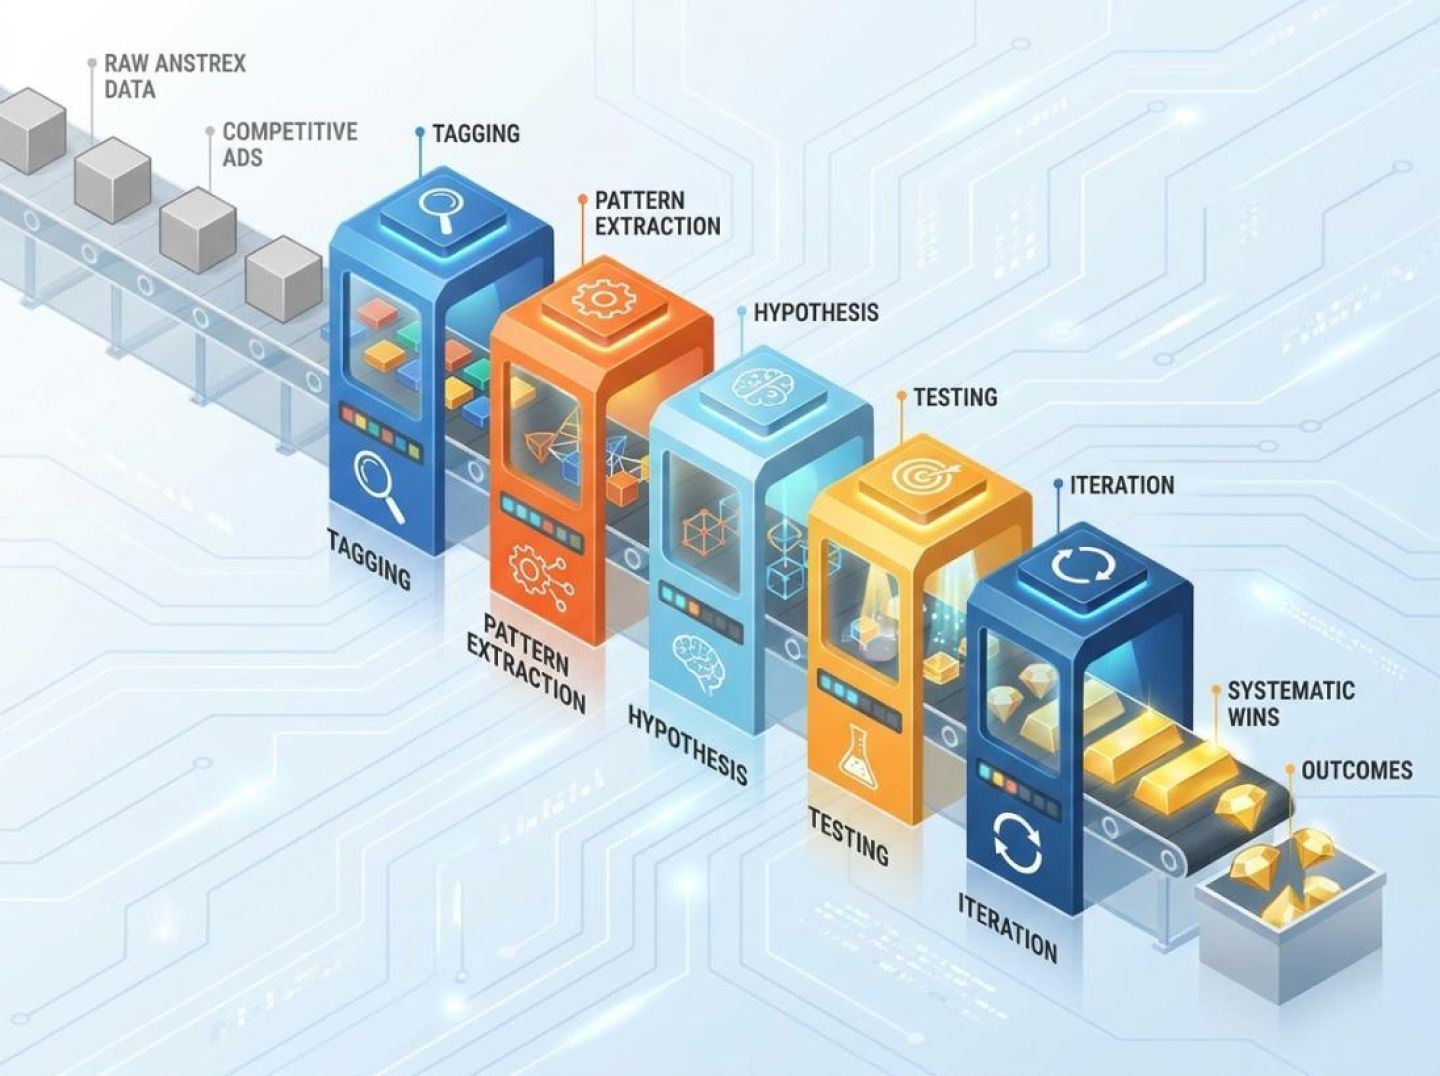
The following workflow turns Anstrex research into a repeatable process.
Start with the problem you want to solve.
Do not begin with the broad question, “What are competitors doing?”
Instead, define a specific objective for the research.
Examples:
Record the essential campaign context:
| Brief field | Example |
|---|---|
| Primary objective | Lower CPA |
| Main KPI | CPA and conversion rate |
| Traffic temperature | Cold |
| Placement family | Native |
| Geographic market | United States |
| Device | Mobile |
| Vertical | Relevant product category |
| Current baseline | Existing campaign performance |
| Test budget | Defined experimental allocation |
This brief becomes the research filter. It helps your team ignore competitor activity that is interesting but irrelevant to the campaign objective.
Inside Anstrex, resist the urge to select one advertisement simply because it appears prominent in a traffic-related filter.
Look for patterns that match the brief.
Filter to your campaign environment
Match the research to your actual conditions:
If your campaign targets US mobile traffic on Taboola, for example, prioritize comparable research instead of mixing unrelated markets and devices.
Identify pattern candidates
Look for:
Long-running advertisements and repeated appearances can indicate sustained campaign activity. They do not independently prove profitability or conversion performance.
Capture the full journey
For every promising pattern, record:
Store these materials in a shared Pattern Bank, such as a Notion database.
Useful tags might include:
The asset is not simply an advertisement. It is a documented pattern that your team can analyze and adapt.
Treat each promising pattern as a small research case study.
Ask four questions.
What intent is the advertisement capturing?
Is it reaching people who are discovering a problem, comparing solutions, or seeking reassurance before purchasing?
What promise receives the most attention?
Does the message focus on saving time, saving money, reducing risk, improving status, or solving a specific problem?
How does the funnel connect the click to the offer?
Look for listicles, quizzes, product comparisons, expert explanations, demonstrations, or other pre-sell structures.
What evidence supports the promise?
Does the page use testimonials, product demonstrations, customer stories, comparisons, guarantees, or other proof?
Comparison-focused funnels can also inform search strategy.
If you repeatedly see advertisers presenting alternatives or comparisons, investigate whether similar search intent exists in your own category.
WordStream's competitive conquesting guidance is a relevant source for exploring comparison-oriented and non-brand keyword approaches. The original draft also references a case study reporting improved ROAS and CPA from comparison terms, but the exact figures should not be generalized without examining the original methodology.
Translate each useful pattern into a reusable internal structure:
Hook → Proof → Objection handling → CTA
And:
Channel → Landing-page type → Offer framing
You are documenting a process that your team can rebuild with its own products, evidence, and messaging.
Once you have a small group of relevant patterns, choose one or two to test.
Avoid changing too many elements at the same time. The objective is to understand which part of the adapted approach contributes to the result.
For example, compare:
Keep the underlying offer and other important campaign conditions as consistent as practical.
Adapt rather than clone
Before launch:
Define success thresholds
Establish the baseline before launching.
For example, decide what level of CPA improvement would justify further testing, while maintaining an acceptable conversion rate and lead quality.
Do not use a percentage threshold as a universal rule. The right threshold depends on your margin, sample size, test budget, and business objective.
Build a test matrix
A manageable initial matrix might include:
Use a dedicated campaign or ad group where possible so that the test budget and results are easier to isolate.
Every experiment should leave behind useful information.
Track three groups of metrics.
Efficiency metrics
Signal metrics
Longer-term indicators
Use a central analytics view to connect the advertisement, landing page, and final conversion.
The original draft references Brax's analysis of tracking native campaigns as an example of the challenges involved in building a broader view across native advertising funnels. The specific source link needs to be restored before publication.
After each test cycle, update two resources:
The Pattern Bank: What was observed, where it appeared, how it was adapted, and what happened.
The Internal Playbook: Which structures deserve another test, which should be avoided, and under what campaign conditions the findings apply.
For example:
“For cold US mobile native traffic, the expert-comparison structure produced a higher quiz completion rate than the generic listicle during this test, but the final purchase difference remains inconclusive.”
That is much more useful than simply labeling an advertisement a winner.
Not every experiment needs to become a permanent campaign.
Use a simple decision framework.
Scale
Expand patterns that meet the agreed efficiency requirements and demonstrate acceptable customer quality.
Shelve
Pause patterns that do not justify further media investment. Retain any useful learning that can inform future tests.
Retain structurally
Sometimes the overall campaign result is average, but the underlying funnel structure reveals something valuable.
For example, a quiz may not immediately beat the control on CPA, but it may reveal a useful way to segment prospects according to their needs.
That structure could inform future email, retargeting, or landing-page experiments.
Document each decision, the evidence supporting it, and what would need to change before reconsidering it.
The strongest Anstrex workflow is not a one-time research exercise.
It is a recurring loop:
This is how competitive ad spying becomes part of the marketing operation rather than a collection of interesting screenshots.
ROAS will remain an important performance metric. It helps advertisers understand the financial return generated by their campaigns.
But it cannot describe the full value of competitive intelligence.
Strategic imitation adds another layer by asking whether the research helped your team identify market changes, improve its creative and funnel decisions, avoid unnecessary experiments, and discover better ways to reach customers.
Anstrex can support that process by helping advertisers investigate visible campaign activity, creative variations, and the funnels behind advertisements.
The value does not come from copying everything that appears successful. It comes from identifying the patterns worth understanding, adapting them responsibly, and validating them with your own data.
The real return from competitive ad spying is not simply a better-performing imitation. It is a marketing system that learns from the market, tests with purpose, and makes smarter decisions with every campaign.
Receive top converting landing pages in your inbox every week from us.
Must Read
ROAS shows what your campaigns return, but not what competitors are teaching the market. Discover how to measure strategic imitation through competitive signals, creative insights, funnel analysis, and a repeatable Anstrex research process.
Samantha Reed
7 minNov 4, 2026
Recently Updated
Cheap media does not have to mean forgettable advertising. Discover how to use competitor spy tools to identify creative patterns, uncover category gaps, and build a repeatable system for producing distinctive ads across lower-cost channels.
Dan Smith
7 minNov 4, 2026
In-Depth
Traditional media is no longer limited to brand awareness. Discover how competitive ad intelligence helps marketers connect billboards, streaming video, native ads, and social campaigns through a unified testing and measurement strategy.
Dan Smith
7 minNov 4, 2026