Native Ads, Pop Ads, Push Ads, TikTok Ads
9 minSeptember 9, 2026

Our spy tools monitor millions of native ads from over 60+ countries and thousands of publishers.
Get StartedMost marketers can tell you, down to the decimal, which ad drove the cheapest click yesterday. Far fewer can tell you which promise in that ad actually produced profitable customers 90 days later.
That blind spot is where most of your ROI quietly dies.
Under pressure to “do more with less,” paid media teams keep doubling down on the visible half of the funnel: audiences, bids, and creatives. New budget gets steered into targeting tweaks and fresh hooks because they’re fast, measurable, and live inside the ad platforms. Yet the moment someone lands on your site, rigor drops off a cliff.
Recent research cited by MarTech shows this disconnect in brutal detail. Marketers overwhelmingly say that optimizing destination pages is one of the most effective ways to improve paid media ROI, but they still pour more money into audience research, AI tools, and ad creative than into the landing pages that actually convert (or don’t). More than half of paid traffic is still dumped onto generic homepages or broad product/category pages—despite the same survey showing that teams who exceed ROI targets are far more likely to use campaign-specific or reusable landing pages that match the click.
In other words: the click isn’t the problem. What happens after it is.
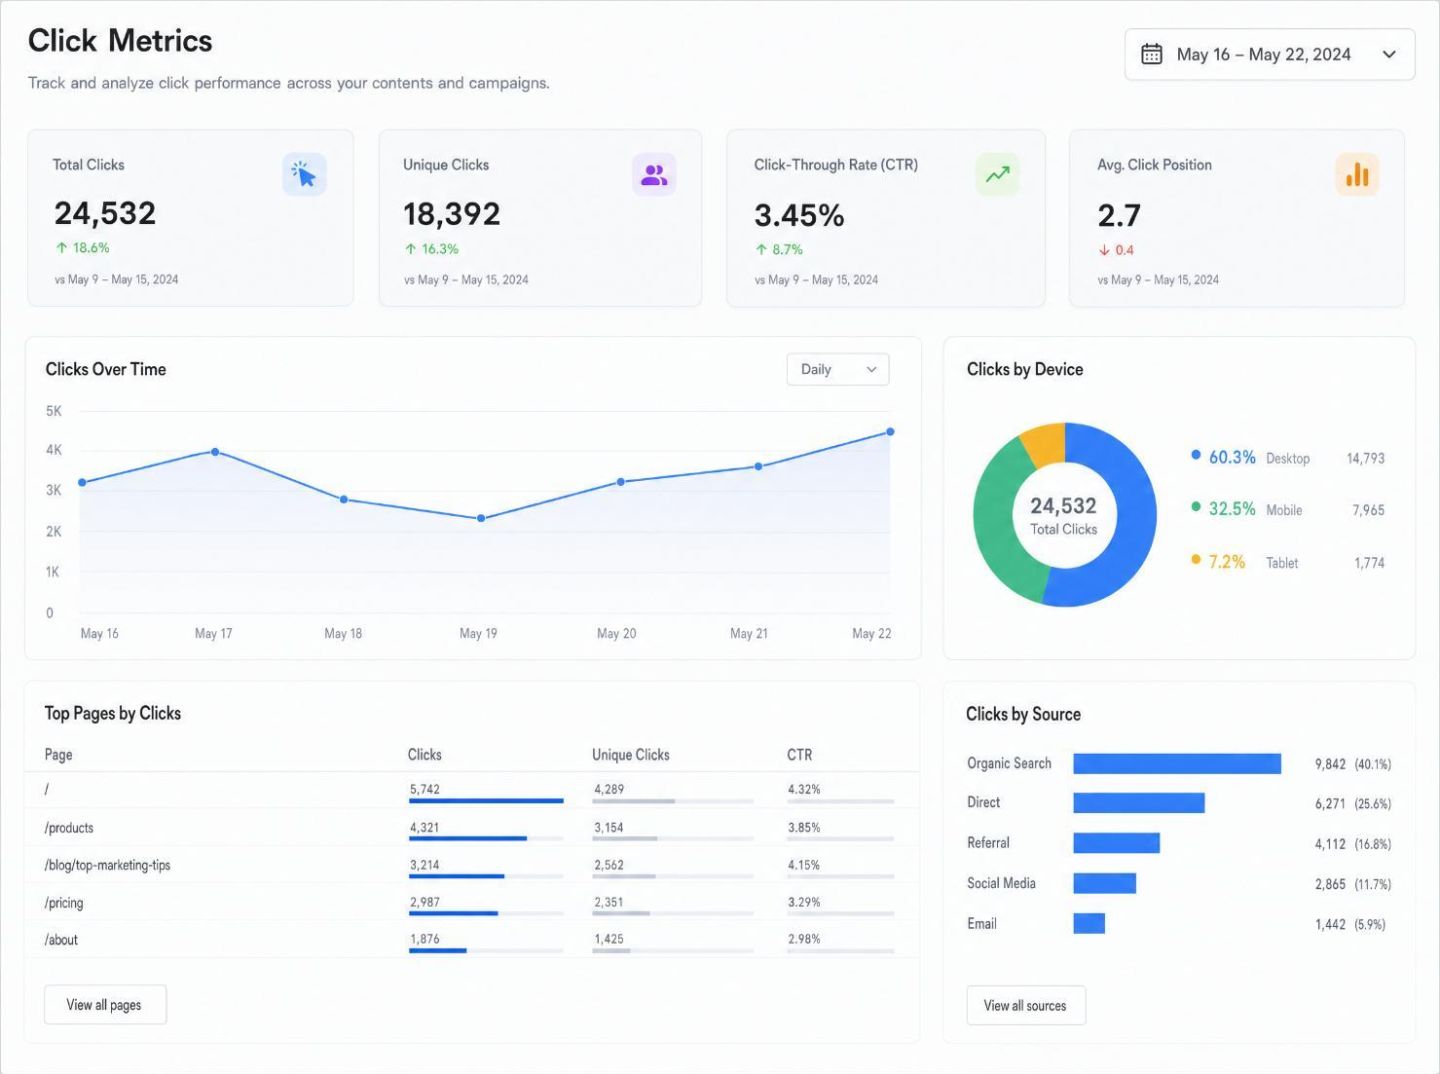
Even when brands invest in analytics, they tend to stop at surface metrics. Many dashboards still revolve around impressions, CTR, and CPC—the easy numbers—while the real leverage sits in how people behave once they arrive. Platforms like Brax explicitly advocate tracking deeper post-click data such as engagement rates, time on site, and conversion ratios because those signals reveal where your funnel is leaking money. But most advertisers don’t feed those insights back into their upstream ad strategy in a systematic way.
The measurement mindset itself is part of the problem. As Semrush’s AI search team points out, attribution models built to count clicks inevitably miss the true influence of a channel; their guide on AI visibility ROI argues that the industry has spent decades treating the click as the relationship, when it was only the slice we happened to instrument. The same trap applies to paid media: if you only optimize to the click, you’re optimizing to the wrong half of the journey.
Now layer in how most marketers actually use their tools. According to the same MarTech research, the vast majority of teams that use AI in paid media rely on it for reporting, targeting, and ad copy. Barely one in five apply AI to landing page creation or optimization—even though the highest performers are almost twice as likely to do exactly that. Technology is being aimed at the most visible levers, not the most decisive ones.
So where do ad spy tools fit in?
Right now, most teams treat them as a way to swipe headlines and banners from competitors. You see what “seems to be working,” lift the angle, test a few variants, and call it a day. But that is only half the story those tools could be telling you.
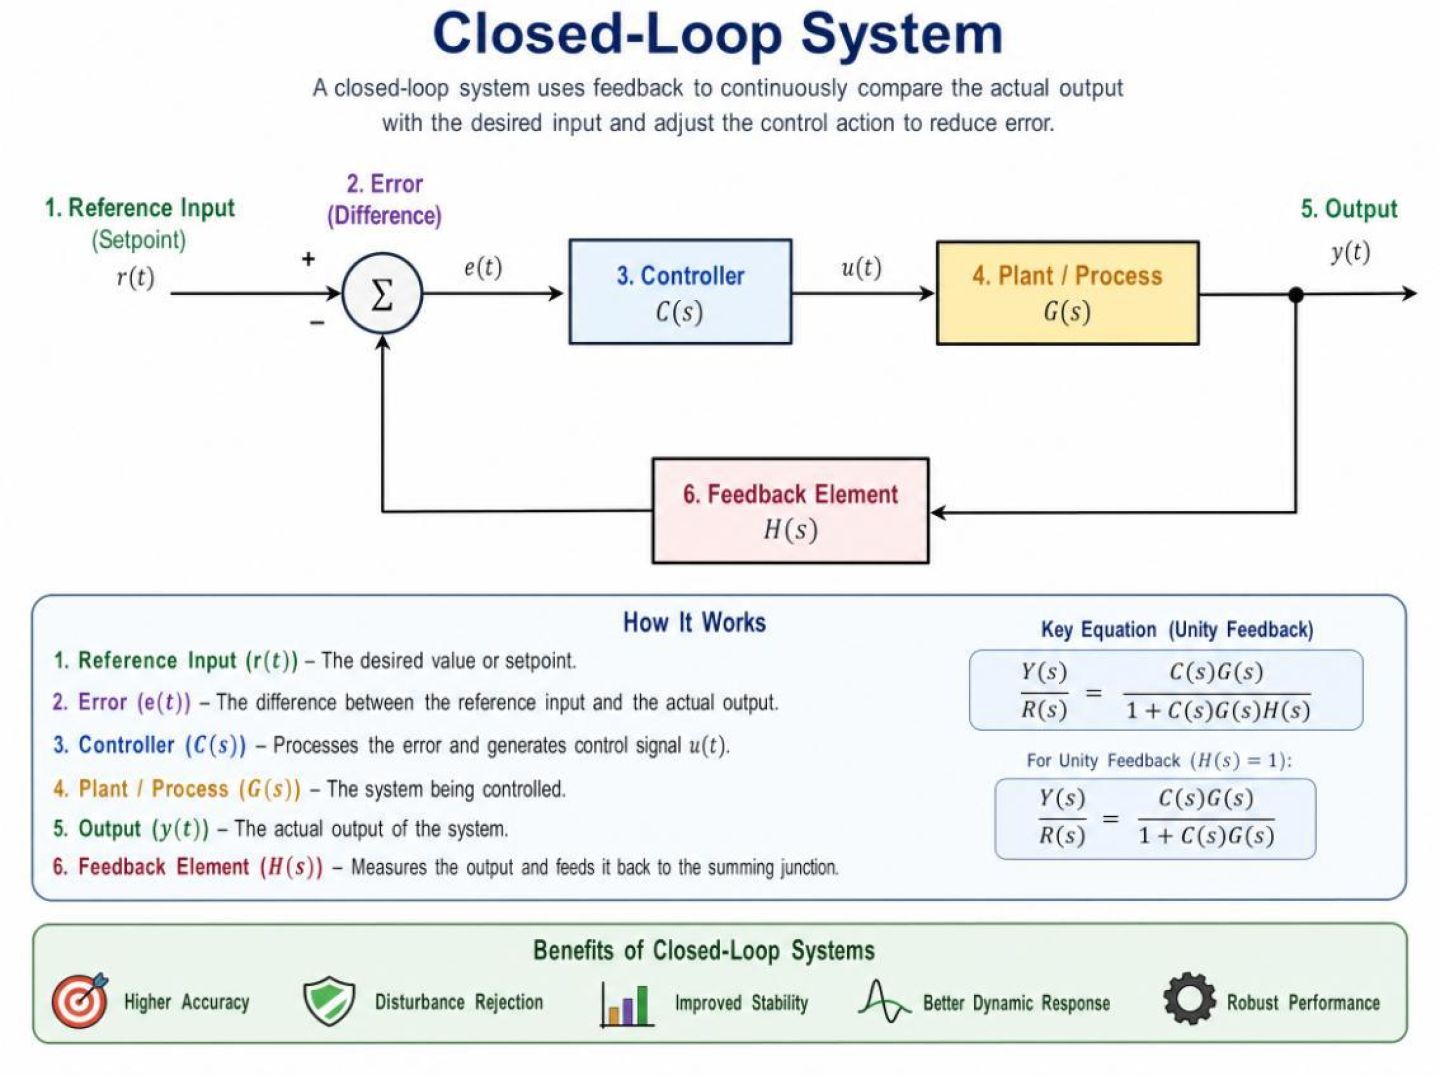
The real opportunity is to turn your spy stack into the missing half of a closed-loop system: not just which creatives are running, but which value propositions actually sustain revenue when they collide with your on-site experience. Imagine pairing what you see in the wild—competitors’ hooks, formats, and funnels—with your own post-click behavior data and LTV outcomes. Instead of guessing which promises to borrow, you’d know which types of promises your system can consistently cash.
This article is about that invisible half of ROI: how to use ad spy tools, not as a shortcut for stealing creatives, but as a way to align off-platform messaging with the on-site feedback loops that determine whether each click becomes a customer, a repeat buyer, or an expensive dead end.
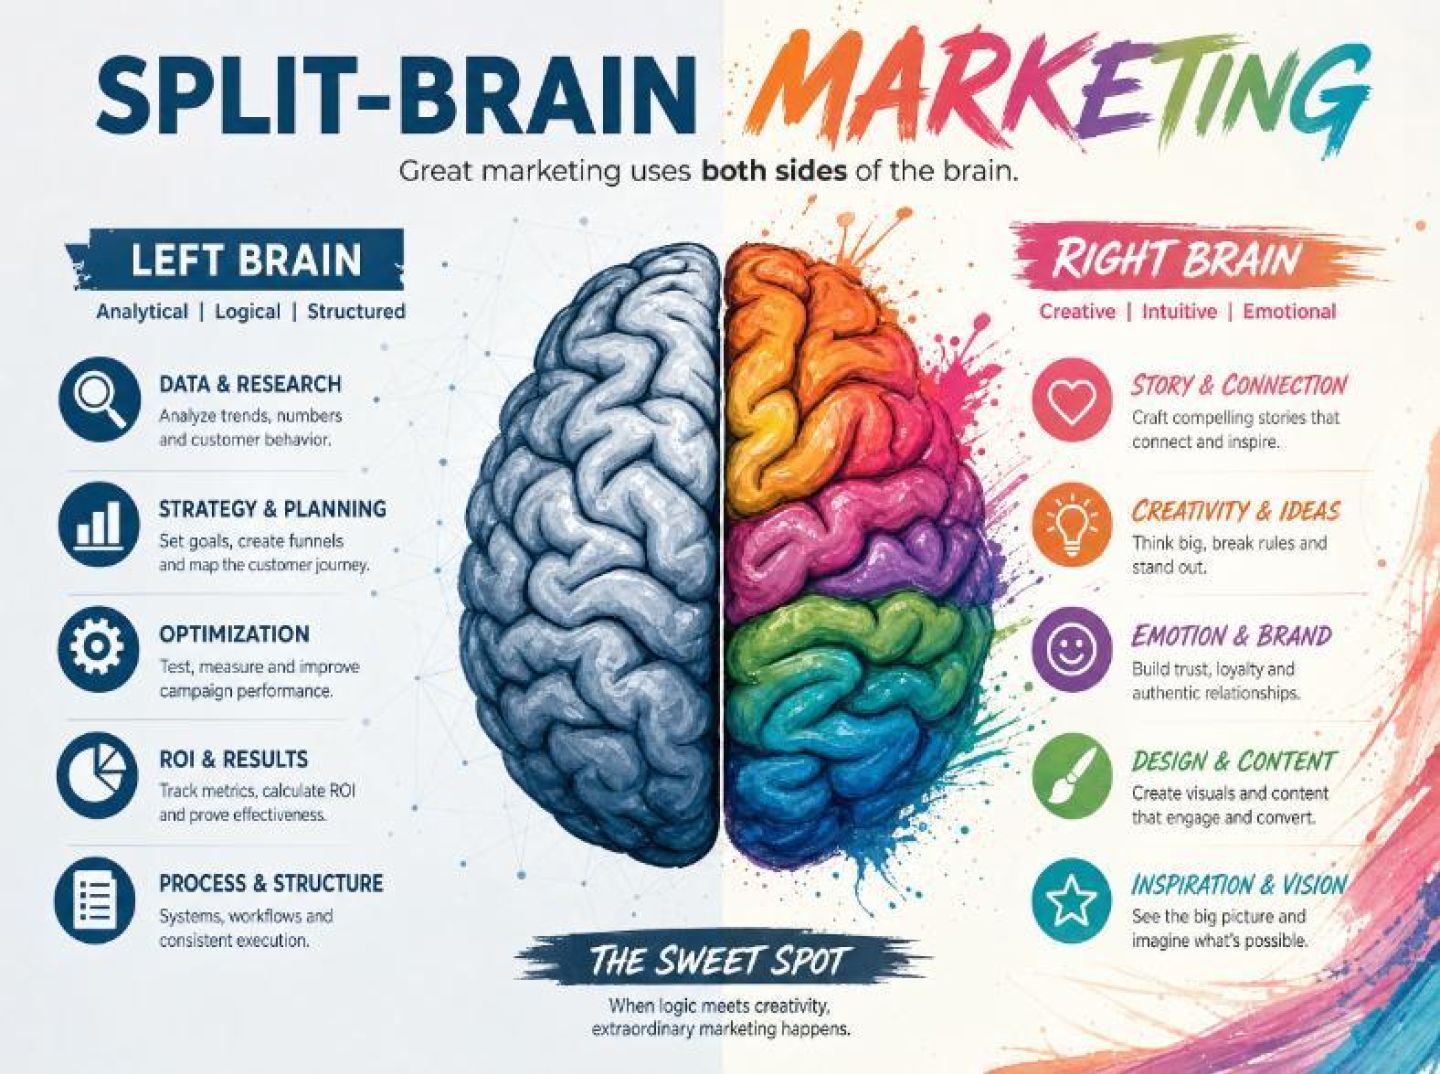
Performance marketing today operates like a split-brain patient: one hemisphere obsessed with what can be counted before the click, the other quietly responsible for everything that happens after it. The two rarely speak.
On the visible side, teams live inside ad managers, optimizing what the platforms make easy to see: CPMs, CTRs, CPCs, ROAS. Every dashboard, alert, and AI “recommendation” is wired to that pre-click hemisphere. Platforms are structurally incentivized to reinforce this focus. As one analysis of the W3C’s proposed standards for ad measurement points out, modern ad systems increasingly optimize toward users who are already likely to convert, then take credit for harvesting that demand, blurring the line between persuasion and pre-existing intent in ways that systematically overcredit lower-funnel channels.
The result is a chronic overinvestment in what’s closest to the conversion event and easiest to attribute: branded search, retargeting, retail media, and click-optimized social campaigns. These environments are extraordinarily good at finding people who were going to buy anyway and putting an ad in front of them at the last possible moment. From the perspective of platform attribution, that looks like performance genius. From the perspective of actual business growth, it’s often demand arbitrage disguised as marketing.
Meanwhile, the other hemisphere — everything that happens post-click and off-platform — runs on a completely different operating system. Landing page relevance, offer framing, objection handling, onboarding, and product experience determine whether that hard-won click turns into a profitable customer or an expensive bounce. Yet most organizations treat this side of the brain as an afterthought.
A recent survey of paid media practitioners found that more than half send paid traffic to general website pages — homepages and generic product/category templates — instead of campaign-specific destinations, even when the stated objective is direct sales or lead generation. Marketers in the study overwhelmingly agreed that destination page optimization is one of the most powerful levers for paid media ROI, yet their day-to-day optimization effort skews heavily toward audiences, creative, and bids, leaving post-click experience near the bottom of the priority list, as research on underinvestment in landing pages and post-click journeys makes clear.
This is the split-brain problem: media optimization is tightly coupled to platform data, while customer outcomes are governed by systems the platforms can’t see. Attribution models try to stitch the two together, but they are built on the same limited observables — impressions, clicks, last-touch paths — that favor channels and tactics living close to the conversion. As critics of attribution-centric standards argue, when you mistake attribution for causal effectiveness, you don’t just mis-measure campaigns; you bake a permanent bias into where budgets flow and what kinds of marketing are even considered “working” according to the way browser standards and platform tools define success.
The fragmentation is getting worse as creative and distribution proliferate. In an environment where a single global brand can coordinate hundreds of thousands of AI-supported creators across dozens of platforms, traditional evaluation systems break down. As one analysis of large-scale influencer and AI-generated content networks notes, human panels, manual A/B tests, and quarterly brand tracking are far too slow and narrow to govern creative at that scale; without a unified feedback infrastructure, you end up with creative decisions made in isolation from media performance and actual customer behavior, a problem described vividly in the context of AI-driven creator networks.
All of this converges on the same underlying issue: the off-platform and post-click parts of the journey aren’t instrumented, modeled, or resourced with the same rigor as pre-click activity. Performance teams are rewarded for squeezing cheaper clicks out of opaque algorithms, while the long-term economics of those clicks — retention, expansion, payback period — are owned by entirely different teams, if they are owned at all.
Until those two hemispheres are wired together by shared feedback loops, you don’t really have performance marketing. You have media buying that looks efficient on paper, and a series of disconnected customer experiences silently deciding whether any of that “performance” ever shows up in profit.
Clicks look like truth because they’re clean, countable, and immediate. But for ROI, they’re dangerously close to a vanity metric.
A click tells you that a human being moved their finger. It does not tell you whether your ad changed a mind, created demand, or pulled a valuable buyer forward in their journey. Most of the economic action that determines whether a campaign was a win or a write‑off happens after that finger move—and most teams aren’t instrumented to see it.
The first problem: click metrics confuse propensity with persuasion. When platforms auto-optimize for conversions, they increasingly serve ads to users who were already likely to buy. As one analysis of modern attribution systems points out, platforms are exceptionally good at harvesting existing demand because they sit closest to observable conversion events—search, retail media, retargeting, and click‑optimized social placements, where in‑market users are already generating strong signals of intent (AdExchanger). When that person finally clicks and converts, the ad platform happily credits itself, even if the ad barely nudged behavior.
In the dashboard, it looks like heroic performance: sky‑high CTR, efficient CPC, decent on-platform ROAS. In reality, you may just be paying a toll on customers who were going to buy anyway. The invisible half of ROI—incremental profit driven because of the ad—never shows up in a CTR column.
The second problem: attribution frameworks were built to count clicks, not to explain causality. Standards discussions around web measurement still treat post‑click attribution as if it were a stand‑in for true effectiveness, even though they’re fundamentally different things. The concern, as one critique of proposed browser‑level attribution frameworks argues, is that the industry is codifying a worldview where “what we can see in the clickstream” equals “what worked,” further biasing budgets toward channels that generate easily observed clicks and away from those that create demand in harder‑to-measure ways (AdExchanger).
You can see the same structural trap playing out in adjacent areas like AI search visibility. Analytics suites surface “AI traffic” as if it were just another source in your acquisition report, but the decision to recommend your brand often happens upstream, inside the model, long before any click you can track. Teams that only measure direct AI‑attributed traffic systematically underreport its contribution to revenue because they’re looking for a click trail that doesn’t exist. As one AI search strategist put it, the click was always just “the part we could count,” not the relationship itself (Semrush).
This is the deeper issue with over‑relying on click metrics: they collapse influence into traffic. Anything that doesn’t produce a neat, last‑touch click looks ineffective on paper—even if it’s quietly compounding your future pipeline.
Meanwhile, even when marketers do look past the click, they often stop at shallow web analytics: bounce rate, session duration, last‑touch conversions. That’s better than CTR, but it’s still the visible layer. What matters for ROI lives underneath:
Platforms and campaign tools are starting to acknowledge this gap. Native and social campaign managers that go beyond surface‑level engagement to track time on site, post‑click engagement depth, and downstream conversion ratios are pointing in the right direction, because they at least anchor optimization in what happens after the session starts, not just that it started (Brax).
But even those richer post‑click metrics are still proxies. The real “invisible half” of ROI is stitched together from CRM data, sales feedback, retention and payback curves, and creative‑level performance over time. That’s where you find the uncomfortable truths that CTR can’t show you: creatives that win the click but attract refund‑prone bargain hunters, targeting that produces beautiful CPA but terrible LTV, and campaigns that look mediocre on-platform yet quietly mint your best customers over the long term.
Until your measurement and optimization loops are rooted in that post‑click reality, click metrics won’t just be incomplete; they’ll be actively misleading.
Most teams open an ad spy tool and immediately start screenshotting winners: “Let’s steal that hook,” “We should try this layout,” “Our competitors are pushing UGC now.” That’s using a microscope like a photocopier.
If you want the invisible half of ROI, you have to flip the purpose: treat spy tools as a revenue lab. The job isn’t to collect creative; it’s to reverse‑engineer the economics and feed those insights into your own post‑click system.
When you see a competitor running the same native headline or Meta creative for months at real spend, assume the question isn’t “Do we like this ad?” but “What on the other side of this click justifies this budget?”
Spy tools give you high‑signal clues:
Instead of just copying the headline, map the economic hypothesis behind it. Are they willing to pay more per click because they’ve built a better lead nurture sequence? Are they routing most paid traffic to a quiz because it pre‑qualifies, lifts AOV, and primes sales? That’s the level at which ROI is actually determined.
This is exactly where most marketers are under‑invested. Research cited by MarTech found that while 40% of paid media pros say optimizing destination pages is one of the most effective ways to maximize spend, only 31% actually invested in landing pages in the previous six months. Budgets flowed to audience research, AI tools, and creative because those are easy to tweak inside the ad platforms. Spy tools should push you in the opposite direction: toward the harder, higher‑leverage work that happens after the click.
When you spot a “winner” in a spy dashboard, use it to design a lab experiment inside your own stack:
3. Instrument your own version for revenue signals, not just CTR:
Build a variant funnel around a similar idea (e.g., trial‑led entry vs. discount‑led), and wire it into your analytics, CRM, and post‑click behavior tracking. Tools like Brax emphasize tracking not only clicks and impressions, but engagement, time on site, and conversion ratios across native and social — exactly the kind of nuanced data you want in this lab.
4. Run controlled tests and watch what happens post‑click:
Your goal is to discover whether the mechanism you observed (risk reversal, social proof, quiz‑based segmentation, etc.) actually increases qualified leads, AOV, LTV, or sales cycle speed in your context.
This shifts the value of spy tools from “shortcut to new ads” to “catalog of revenue hypotheses you can validate against your own data.”
There’s a deeper reason this approach matters. Attribution systems and platform dashboards naturally over‑credit the channels closest to observable conversion events and users already primed to buy. As AdExchanger explains, modern optimization engines are structurally biased toward harvesting existing demand rather than proving whether an ad actually persuaded anyone. If you only chase what “looks good” inside the platforms, spy data just becomes more fuel for a biased loop.
Instead, fold spy‑driven experiments into a broader, mixed measurement framework:
When you treat spy tools as a revenue lab, the question stops being “Which ad can we copy today?” and becomes “Which monetization patterns are our market already rewarding — and how do we test, adapt, and out‑execute them inside our own post‑click system?” That’s how you turn competitive intelligence into compounding ROI, not just more screenshots in a swipe folder.
When you wire your spy stack into revenue data, Anstrex stops being a Pinterest board of other people’s ads and starts behaving like your own causal inference engine.
The mechanics are deceptively simple:
At that point, your “spy system” crosses an important threshold: it becomes a measurement layer that connects off-platform influence to on-site economic outcomes.
This is exactly the gap that measurement practitioners warn about when they argue that attribution is not the same as causality. As one analysis of the W3C’s privacy and ads proposals points out, modern attribution frameworks overcredit channels that sit closest to observable conversions and systematically undercredit media that creates demand earlier in the journey, such as broad social and video impressions on the open web, because their effects are probabilistic, delayed, and hard to observe directly through clickstream data (AdExchanger).
A closed loop from Anstrex to CRM is your workaround. You are not reliant on the platform’s view of who “deserves” the conversion. You can see that:
Instead of arguing with the platform’s black box, you’re scoring patterns on the metrics that matter to your balance sheet.
This is the same structural move that creative-intelligence platforms are making at the high end of the market. When DAIVID’s creative models are wired directly into ADIN.AI’s media execution, they create a live loop where creative is scored, linked to performance, and used to rebalance spend while the campaign is still in flight, rather than judged in isolation after the fact, which is how their CEO describes the problem they set out to solve in a recent analysis of AI-driven influencer networks (Search Engine Journal).
You are doing a leaner version of that infrastructure with Anstrex on the front end and your CRM on the back end. Your “creative clusters” become the unit of analysis:
Notice how similar this is to the way AI visibility has to be measured. Analysts of AI search point out that the decision—the recommendation, the impression, the persuasion—happens inside the model, long before you see a click or a direct visit, which means you cannot treat AI simply as another traffic source in GA4 (Semrush). Their recommended fix is to combine multiple signals: prompt logs, brand search, self-reported attribution, CRM data, and sales feedback, then tie those blended signals to pipeline and revenue.
Your spy stack is dealing with the same measurement physics. Off-platform ads, dark social screenshots, pre-click influence inside algorithmic feeds—none of that shows up neatly in last-click dashboards. By tagging the creative and funnel approaches you’re borrowing, then following them all the way through to qualified demand and cash collected, you move from counting what’s easy (impressions, clicks, CTR) to what’s economically true.
Once that loop is closed, “top ads in my niche” is no longer the product. The product is an in-house attribution engine that tells you:
The screenshots are just the raw material. The power is in the feedback loop that turns those screenshots into a living, compounding map of how persuasive ideas move through your market and end up as revenue on your books.
Channel playbooks are where spy data stops being abstract and starts touching wireframes, copy, and routing rules. Each format has its own economics and its own way of feeding your on‑site feedback loop. Here’s how to build those loops for native, push, pops, and TikTok without falling into the “last‑click or nothing” trap that so many attribution systems encourage, especially when they over‑credit lower‑funnel, click‑heavy channels the way AdExchanger describes.
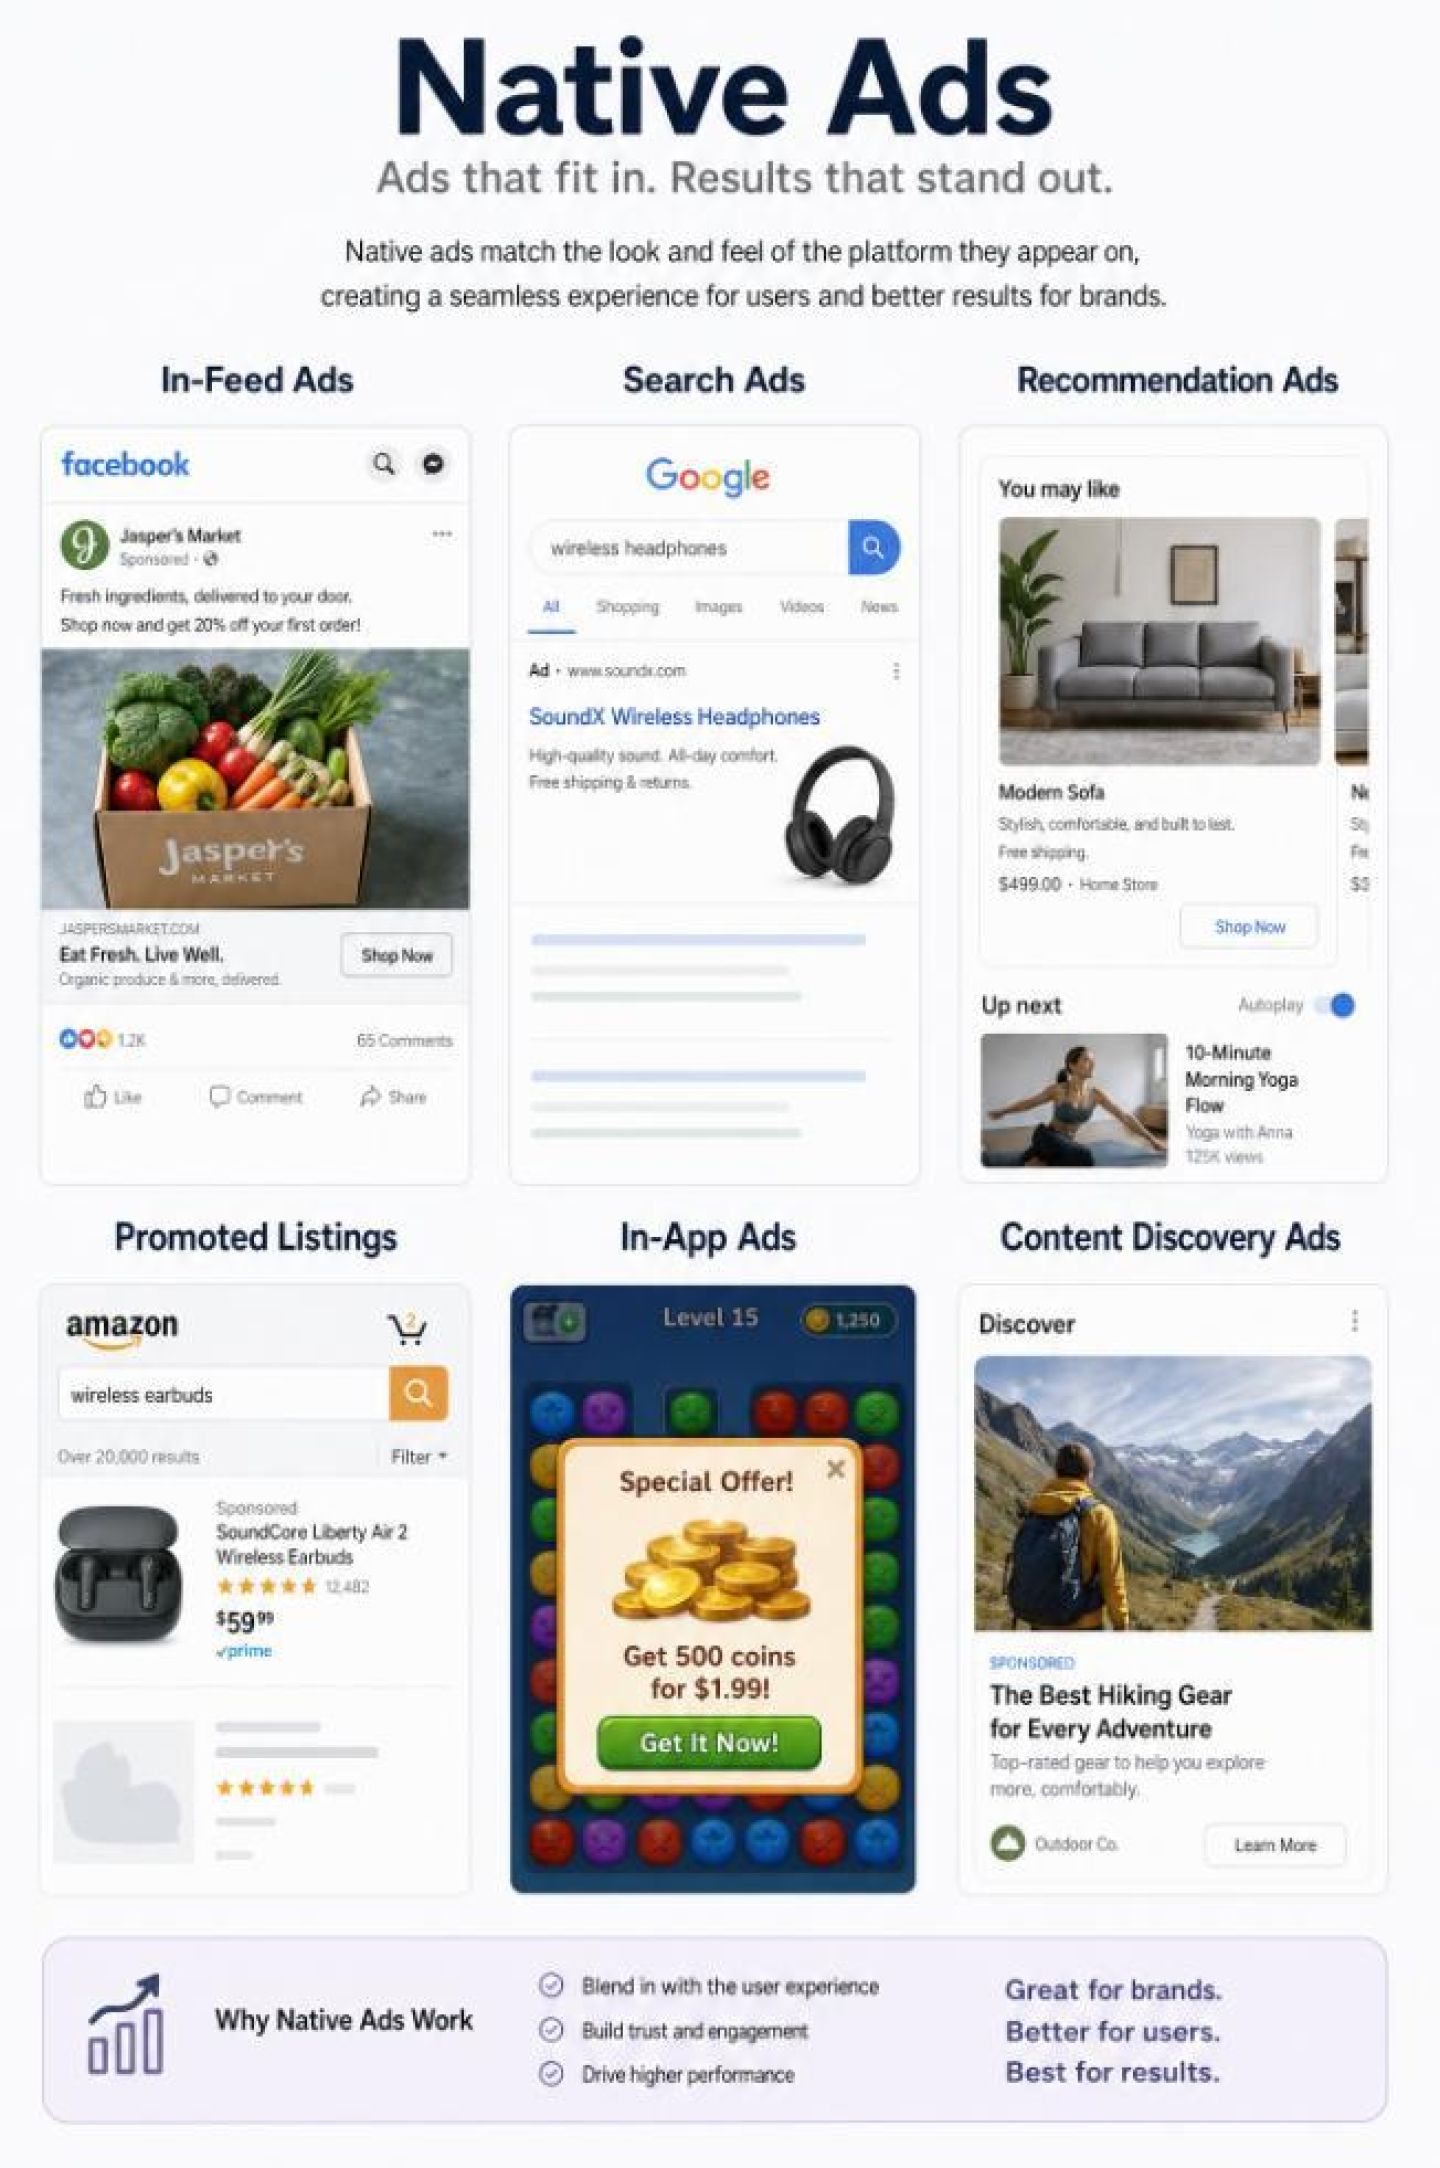
Spy tools like Anstrex make native look deceptively simple: swipe the winning headline formula, mirror the pre‑sell page, profit. But native arbitrage only works when the off‑platform story and on‑site economics speak the same language.
Use your spy feed to:
Closed‑loop move: In your CRM, tag native sessions by narrative cluster, not just by network or placement. Then analyze revenue per click and lead quality by narrative. When a theme like “joint pain relief in 7 days” produces more high‑LTV customers than “celebrity skincare secret,” you don’t just buy more of those placements—you rebuild your on‑site quiz, email onboarding, and upsell logic around that pain narrative.
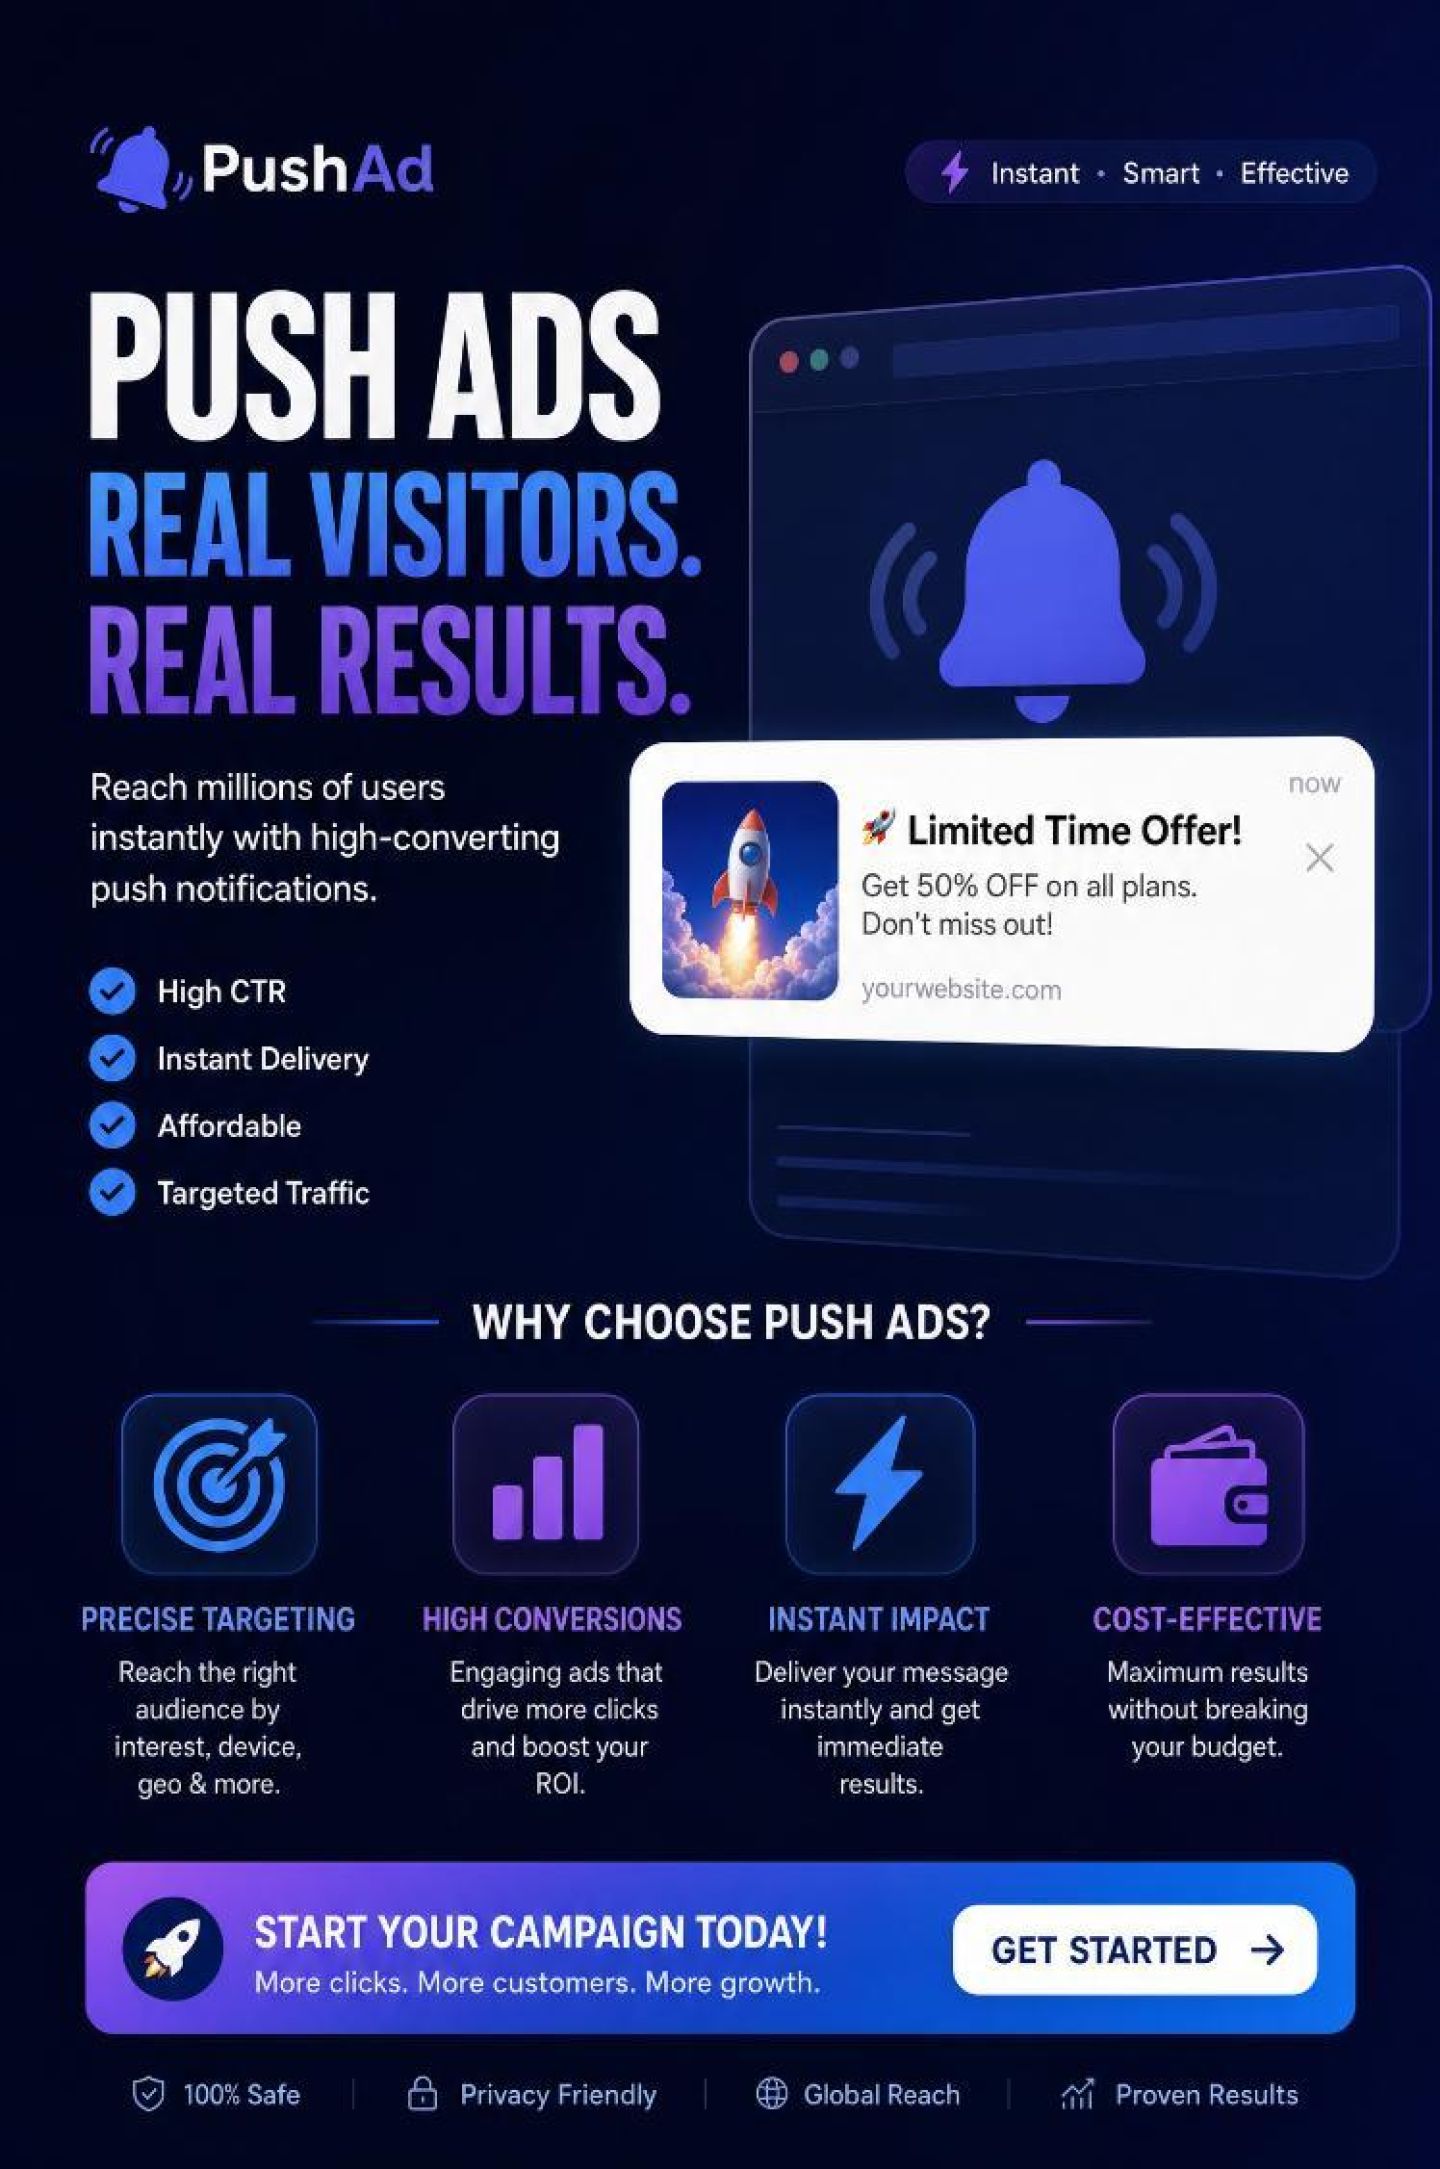
Push traffic is cheap, jarring, and often accidental. Spy tools show you the hooks that get opened (“Your account was flagged,” “Package delivery failed,” “3 messages waiting”), but the win comes from what happens 10 seconds after the tap.
Use your spy intel to:
Closed‑loop move: Build your analytics and CRM to log push hook category and landing type on every session. Then run revenue and churn analysis by hook‑landing pairing. This is exactly the kind of pattern that AI optimization tools can work with; as one piece on autonomous agents in MarTech notes, agents can reallocate budgets and test thousands of creative/landing combinations when they’re wired into end‑to‑end performance data. Feed your best‑performing push patterns back into those agents and your spy research becomes a live testing backlog, not a static swipe file.
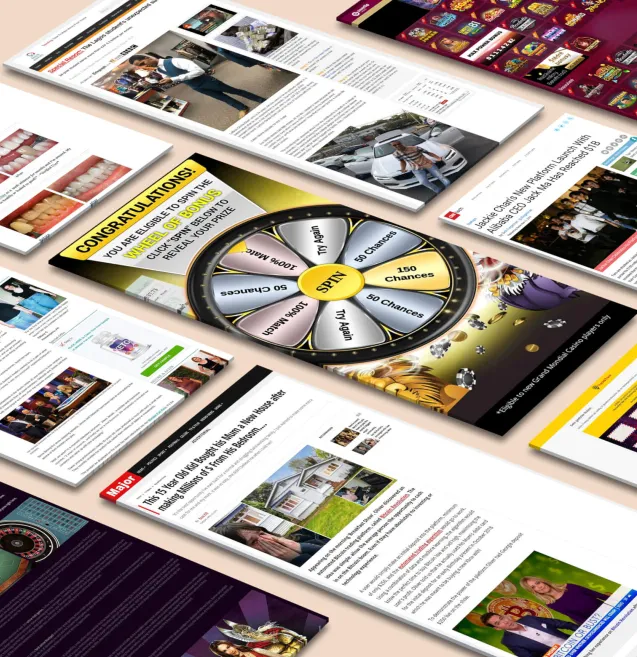
Pop and redirect traffic are blunt instruments: intrusive, low intent, and measured at scale. When you browse spy data here, you’ll usually find two winning archetypes:
Use spy tools to quantify how much warming the top affiliates are doing. Are they sending straight to an advertorial, or using a 3–5 question quiz first? Then:
Closed‑loop move: In your CRM, store bridge responses as attributes and correlate them to average order value, refund rates, and LTV. Over time, you’ll see which “personas” generated by those quiz answers are actually profitable. That’s your guardrail against the structural bias toward low‑funnel clicks that AdExchanger warns about—some pop campaigns will look great on day‑one revenue and terrible on six‑month payback.
TikTok is where spy tools start to look like a real‑time creative intelligence network. The volume of UGC, hooks, and micro‑trends makes manual A/B testing obsolete in the way a recent piece on creator scale and AI content argued in Search Engine Journal: human‑only evaluation systems simply can’t keep up.
From your TikTok spy feed:
Closed‑loop move: Use UTM parameters and pixel data to pass creative angle and format into your CRM on every lead or order. Then build reports that compare, for example, “POV confession + quiz funnel” vs. “problem/solution + direct PDP” on downstream metrics like upsell acceptance and repeat purchase. This is how you move beyond measuring TikTok as just another last‑click source and start treating it as an influence channel, in the same spirit that an AI visibility guide on the Semrush blog recommends measuring “proximity over proxy” when a lot of the persuasion happens before the final click.
Across native, push, pops, and TikTok, the pattern is the same: use spy tools to steal structures, not just slogans; tag every structural choice inside your analytics; and let your CRM revenue tell you which off‑platform patterns deserve more budget and which belong back in the swipe file.
Receive top converting landing pages in your inbox every week from us.
Must Read
Learn how to build a responsible competitive ad intelligence workflow for an advertising landscape increasingly shaped by AI-generated creatives, disclosure labels, and digital watermarks. Discover how to analyze competitors’ AI usage, identify creative patterns, and develop ethical guardrails that support transparent, compliant, and differentiated campaigns.
Dan Smith
7 minOct 23, 2026
Most Read
Discover how performance marketers can build cross-channel verification journeys that turn skeptical prospects into confident buyers across TikTok, native, push, and pop advertising. Learn how to coordinate creative messaging, reinforce trust at every touchpoint, and measure the hidden influence of fragmented customer journeys using competitive ad intelligence.
Elena Morales
7 minOct 20, 2026
Most Read
Discover how performance marketers can combine AI-generated content and competitive ad intelligence to build effective campaigns across native, pop, and push advertising networks without sacrificing originality or consumer trust. Learn how to analyze competitor funnels ethically, develop distinctive landing pages with AI, and establish practical guardrails for transparent, compliant, and sustainable campaign optimization.
Priya Kapoor
7 minOct 19, 2026