6 minJuly 27, 2026

Our spy tools monitor millions of native ads from over 60+ countries and thousands of publishers.
Get StartedPicture a celestial body so massive it warps the trajectory of everything around it. That's social media advertising right now — and it's only getting heavier. According to Omdia's first-ever dedicated social media advertising report, social media ad revenue is projected to compound at 12% annually over the next five years, reaching $640 billion by the end of 2030. During that same window, social's share of total online advertising will swell from 33% to 44% — a ten-percentage-point land grab that puts it alongside retail media as the fastest-growing segment in digital. When nearly half of every digital dollar ends up inside a social feed, we've moved past "channel preference" into something closer to gravitational inevitability.
The fuel accelerating this pull is video. Reels, TikTok, Shorts, and Stories already accounted for 60% of total social media ad revenue in 2025, and these formats aren't just growing organically — they're actively siphoning budgets that once went to publisher display inventory and broadcasters' digital offerings. TikTok alone illustrates the velocity: global ad revenue growing at 43% year over year with engagement rates eight times higher than Instagram's, plus a commerce arm that more than doubled U.S. sales in a single year. When a single platform can claim full-funnel utility from awareness through checkout, the budget conversation shifts from "should we be there?" to "how much more can we pour in?"
But here's the number that should unsettle every performance marketer: 90% of global social media ad revenue is concentrated in just six apps — Facebook, Instagram, Douyin, YouTube, TikTok, and WeChat. Meta's ownership of both Facebook and Instagram hands it 54% of worldwide social ad revenue, a figure that balloons to nearly 70% once you exclude China. This isn't a market; it's an oligopoly with a self-serve checkout counter.
The concentration is self-reinforcing, and AI is the mechanism. As Omdia Principal Analyst Kia Ling Teoh put it, AI-driven targeting and recommendation algorithms are "turbocharging the advantage" of these walled gardens, whose deep user data and sophisticated computing infrastructure lock out smaller competitors. And as AdExchanger has noted, global ad spend hit $710 billion in 2025, with social and CTV growing far faster than display or online video — meaning the platforms absorbing the most money are also the ones whose algorithms dictate how that money performs.
This is exactly the problem. When every advertiser has access to the same Advantage+ campaigns, the same broad-targeting Reels placements, and the same algorithmic bid strategies, the platforms' AI doesn't produce differentiated outcomes — it produces convergence. Your competitors are feeding the same machine the same signals and getting functionally similar optimization. You're not making a strategic allocation at that point; you're paying a crowding premium for the privilege of fighting over the same algorithmically identified audiences. The moat isn't the platform's targeting anymore. It's what you know about the competitive landscape that the algorithm can't tell you — and how fast you can act on it.
Here's a number that should stop every performance marketer mid-scroll: ROI has risen 4 percent since Covid, but the incremental profit those campaigns actually generate has fallen 11 percent in real terms. That's the headline finding from IPA Databank research, and it exposes a paradox that's quietly hollowing out marketing departments everywhere. The industry is getting "better" at generating returns on paper while getting measurably worse at the only thing that matters — growing the business.
How is that possible? Because ROI is a ratio, and you can inflate a ratio just as easily by shrinking the denominator as by growing the numerator. Cut your budget, narrow your targeting, cherry-pick the cheapest conversions, and your dashboard will reward you with a beautiful efficiency score. But you haven't grown anything. You've simply retreated to the safest, most saturated corner of the market and declared victory.
The IPA research reveals just how endemic this thinking has become. Fifty-two percent of firms use ROI as their single most popular metric for budget setting — a practice the report's authors call "a recipe for underinvestment". Worse, 76 percent of firms do no financial modeling whatsoever when setting their marketing budgets, and 28 percent never even have a joint discussion with their CFO during the process. The result is a self-reinforcing cycle: tight budgets demand efficiency, efficiency demands narrow targeting, and narrow targeting means 56 percent of firms are now reaching only a small segment of their addressable market. Broad-reach campaigns — the kind decades of evidence show actually build brands and grow categories — are increasingly dismissed as "wasteful."
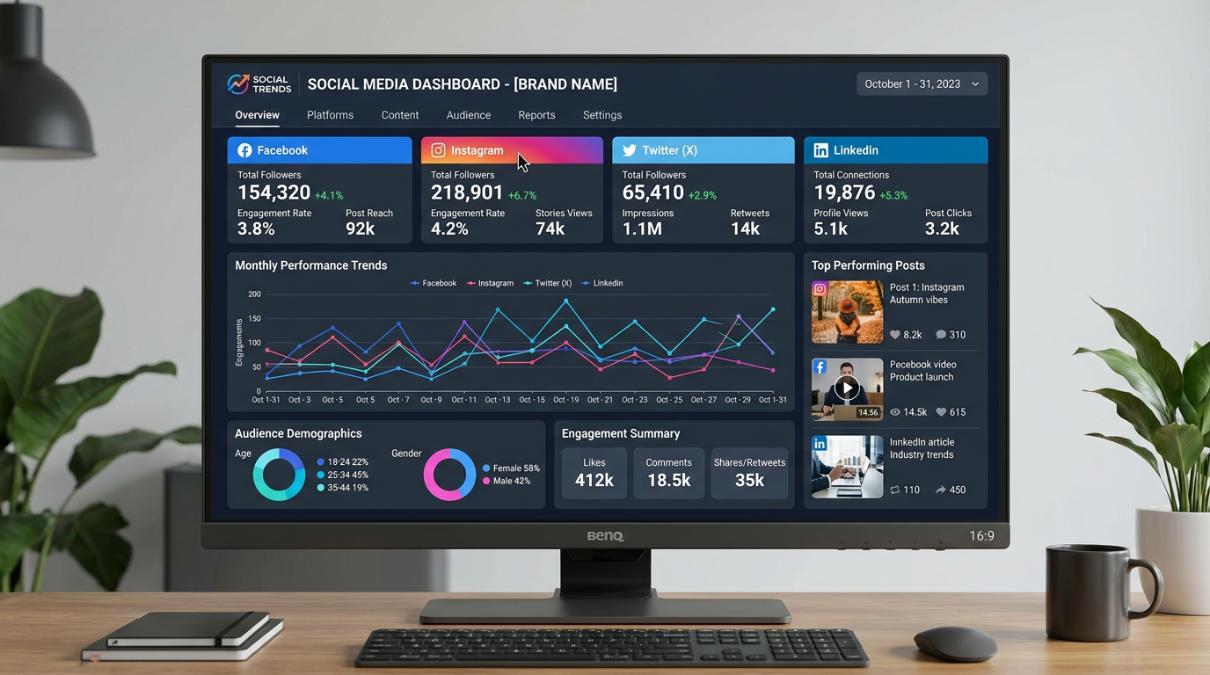
This is where the social media gravity well described in Section 1 becomes genuinely dangerous. When marketers optimize for platform-reported metrics — cost per click, cost per acquisition, return on ad spend — they're optimizing inside a closed system that rewards them for doing less with less. Social dashboards will happily tell you that your CPA dropped 15 percent this quarter. What they won't tell you is that you're fishing in the same shrinking pond as every competitor, bidding on the same high-intent audiences, while the vast majority of future category buyers never see your brand at all.
The problem compounds across channels. As AdExchanger has reported, signals remain fragmented across teams and platforms — social, display, CTV, and video are still evaluated in silos with inconsistent metrics and definitions. Even when cross-media data is available, it rarely converges in a form that makes comparison intuitive or action-oriented. This fragmentation means most marketers lack the visibility to see that their "efficient" social spend is cannibalizing reach they could achieve more profitably elsewhere, or that a competitor has quietly shifted budget into an underpriced channel they're ignoring entirely.
The IPA research frames the consequences bluntly: the quest for efficiency is actively destroying profits. Marketers aren't doing more with less — they're doing less with less, mistaking a shrinking denominator for genuine performance improvement. And because so few organizations tie their budget-setting process to any rigorous financial model, there's no mechanism to catch the error until market share has already eroded. By then, the cost of recovery is far higher than the cost of proper investment would have been.
The uncomfortable truth is that your social media dashboard is not a business intelligence tool. It's a sales tool — built by the platform to demonstrate enough value to keep your spend flowing. Confusing it with strategic measurement is exactly how you end up with rising ROI, falling profit, and a CMO who can't explain to the board why brand awareness just hit a five-year low.
Every gold rush creates ghost towns somewhere else. As social media advertising barrels toward $640 billion by 2030 — with just six apps capturing 90 percent of that revenue — something structurally interesting is happening on the other side of the ledger. Publisher-side inventory, the open web's native ad placements, and push notification channels are becoming relatively cheaper, not because they've gotten worse, but because the herd has stampeded in the opposite direction. Omdia's research makes this explicit: social platforms are actively capturing budgets historically directed toward other digital channels, including online publisher inventory. That's not a market correction — it's a capital migration that leaves behind mispriced attention.
This is classic arbitrage, and it's hiding in plain sight.
Consider native advertising — the format designed to match the look, feel, and editorial context of the content surrounding it. Unlike banner ads, which users have trained themselves to ignore, native units sit within the browsing experience itself: in-feed articles on a news site, recommended content widgets, sponsored editorial on a lifestyle publisher. The engagement mechanics are fundamentally the same ones that make social ads effective — authenticity, contextual relevance, seamless integration — yet the auction dynamics are far less crowded.
The scale of native is already enormous. As Basis explains in its overview of the channel, native programmatic advertising now constitutes 95 percent of all native display ad spending, and roughly two-thirds of all programmatic display spending is native. But here's the underappreciated nuance: native's share of total display has plateaued recently, largely because advertiser attention and incremental dollars have poured into social. That plateau isn't a performance problem — it's a demand-side vacuum. The inventory is growing, the formats are evolving, and fewer competitors are showing up to bid.
And the format options have expanded far beyond static thumbnails. Modern native campaigns can deploy animated GIFs, carousel ads showcasing multiple products, click-to-watch video units with embedded calls to action, and instant-play video — formats that rival the creative flexibility advertisers prize on social platforms. Meanwhile, programmatic infrastructure is pushing native placements into entirely new environments. Connected TV, digital out-of-home, and podcast inventory are all opening up native-style integrations, creating fresh supply at a moment when demand is disproportionately locked inside walled gardens.
Push notifications occupy an even less competitive niche. Browser and mobile push channels deliver messages directly to opted-in users with near-instant visibility, zero algorithm gatekeeping, and CPCs that often run a fraction of comparable social placements. They lack the glamour of a TikTok campaign, which is precisely why they work for performance marketers willing to test unglamorous things.
Smart operators aren't treating this as an either-or proposition. They're keeping their core spend on social — where the data infrastructure and full-funnel attribution remain unmatched — while reallocating marginal dollars to these adjacent channels where the same creative principles apply but the competition is thinner and the cost per engagement is structurally lower. The key insight is directional: when 44 percent of all online ad revenue is projected to consolidate into social by decade's end, the remaining 56 percent doesn't become worthless. It becomes undervalued. And in performance marketing, undervalued attention is the only kind worth buying at scale.
Most marketers think competitive intelligence means screenshots of rival ads. That's like reading a restaurant menu and believing you understand the chef's supply chain. The real advantage lives not in what competitors are running but in where they're moving money — and what that movement tells you about market conditions you haven't noticed yet.
Modern competitive intelligence has evolved into something far more sophisticated than a creative swipe file. The most valuable signals now hide in media allocation decisions, efficiency trends, placement strategies, and channel shifts — patterns that, as AdExchanger reported, "rarely appear in earnings calls, press releases or traditional reporting. They appear first in the auction." A competitor's CPM drops on Facebook. Another brand quietly ramps spend on native placements. A third starts concentrating budget in a single geographic region. Each of these is a data point. Strung together, they're a strategic roadmap drawn by someone who already did the expensive testing for you.
Consider how this plays out in the insurance category. Progressive doesn't simply outspend its rivals — it outbuys them. Polaris AI's analysis of the category revealed that Progressive's consistently lower acquisition costs likely reflect a media strategy built on audience precision and diversified placement, not raw budget size. That distinction matters enormously. If you're a competing insurer and you only track Progressive's creative output — the Flo spots, the comparison tool messaging — you're studying the surface while the real strategic advantage operates underneath, in how and where those ads get bought.
The challenge is that these signals surface simultaneously across markets, formats, and platforms. Budgets now move fluidly across channels, and the old model of siloed dashboards evaluated by different teams using inconsistent metrics simply cannot keep pace. By the time a quarterly report flags a competitor's channel shift, the arbitrage window has closed. The marketers who win aren't running bigger budgets — they're the ones who notice when a rival quietly moves 15 percent of spend into an under-competed channel and arrive second instead of never.
This is where the distinction between observation and interpretation becomes critical. Seeing that a competitor like Tula invests heavily in TikTok while neglecting YouTube entirely is an observation. Understanding whether that gap represents a tested-and-abandoned channel or an untapped opportunity requires layering in additional context: trend data over time, spend consistency across months, and whether the pattern holds across similar brands in the category. A spike that quickly drops off might signal a failed test. Sustained investment over many months suggests the channel is generating real returns.
When a competitor's CPM drops on social while their native presence simultaneously increases, that's not random noise. It's a channel diversification strategy you can reverse-engineer. The CPM decline suggests they're pulling budget, reducing auction pressure on themselves, while the native ramp-up indicates they've found efficiency elsewhere. The marketer who reads both signals together sees the full picture: a deliberate rebalancing driven by performance data that competitor already validated with their own dollars. Your job isn't to copy the move — it's to understand the logic beneath it, test whether the same dynamics apply to your audience, and act before the rest of your category catches on and competes away the margin.
The marketing industry's data problem was never about scarcity — it was about fragmentation moving faster than human synthesis. Global ad spend hit $710 billion in 2025, and the channels absorbing the fastest growth are precisely the ones generating the most complex, siloed signal sets. Video formats alone accounted for 60 percent of social media advertising revenue last year, while CTV, retail media, and programmatic native each maintained their own measurement ecosystems. Budgets now move fluidly across these channels — a competitor can shift six figures from Meta to TikTok to connected TV in a single quarter — but the dashboards most teams rely on were designed for a world where channels stayed in their lanes and analysts had weeks to produce a PowerPoint.
The traditional workflow is brutally sequential: gather data from each platform, normalize metrics that were never meant to be compared, build a dashboard, wait for an analyst to interpret the dashboard, then schedule a meeting to discuss the interpretation. By the time a decision is made, the competitive landscape has already shifted. This isn't a hypothetical lag — it's structural. When IPA research found that 76 percent of firms do no financial modelling as part of their budget-setting process, it revealed a deeper truth: most organizations don't lack data, they lack the interpretive infrastructure to act on it in real time. The bottleneck was never data access. It was interpretation speed.
This is the gap AI-powered intelligence platforms are designed to collapse. Instead of requiring a team to manually cross-reference competitor spend across display, social, and video — the kind of channel-by-channel analysis that tools like Semrush's AdClarity surface through trend charts and publisher breakdowns — AI-driven systems can synthesize those signals simultaneously, flagging anomalies and shifts the moment they appear. A natural-language query like "Which competitors increased TikTok spend more than 30 percent this quarter while reducing YouTube budgets?" returns an answer in seconds rather than requiring a three-day analyst sprint. Proactive alerts notify teams when a rival launches in a new market or pivots creative strategy across platforms, turning competitive intelligence from a monthly report into a continuous strategic input.
Platforms like Polaris AI represent this shift because they don't simply automate the old workflow — they replace it entirely. The gather-build-wait-decide loop collapses into a single interaction layer where the question and the answer exist in near-simultaneous proximity. Cross-channel comparison becomes native rather than assembled. And because AI can hold the full context of competitor behavior across formats, geographies, and time periods, it surfaces the kind of pattern recognition that would take a human team days of spreadsheet work: a competitor testing short-form video in three European markets simultaneously, or a brand systematically increasing its share of voice in a category where the IPA's own data shows that setting share of voice above market share is one of the most reliable predictors of growth.
The implication for performance marketers is straightforward but uncomfortable: if your competitive intelligence still arrives as a static report, you're making decisions on a time delay your competitors may have already eliminated. The gap between "data-rich" and "decision-ready" is where most marketing teams lose — not because they lack information, but because their workflow was built for a market that no longer exists.
Everything discussed so far — the gravitational pull of social budgets, the intelligence hiding in auction signals, the limitations of dashboard-era workflows — collapses into a single question: What do you actually do on Monday morning? Here's a practical framework that turns competitive intelligence into reallocation decisions with measurable impact.
Step 1: Audit your spend concentration against the market's default. Most brands have drifted toward a social-heavy allocation without ever consciously choosing it. Pull your channel-level spend data for the past six months and map it against category benchmarks. The goal isn't to match competitors — it's to understand where you've converged with them and where genuine white space exists. Tools like AdClarity let you see how a competitor distributes their budget between display, social, and video ads, which immediately reveals whether your allocation is a strategic choice or an inherited default. If 70 percent of your budget sits in the same two platforms as every rival, you're competing on creative alone while ignoring structural advantages elsewhere.
Step 2: Use competitive intelligence to find channels where rivals are underinvesting or retreating. This is where the spy game earns its name. Look for asymmetries — moments where a competitor's spend on a channel drops off while yours remains stable, or where they've never shown up at all. As AdExchanger reported, the most valuable competitive signals are hidden in media allocation decisions, efficiency trends, and channel shifts, and they rarely appear in earnings calls or press releases. A competitor pulling budget from YouTube doesn't necessarily mean YouTube is broken; it may mean they lack the creative infrastructure to win there, which creates an opening for you.
Step 3: Pressure-test your efficiency metrics against actual effectiveness. ROI as a standalone budget-setting metric is dangerously seductive. IPA research found that 76 percent of firms do no financial modelling when setting marketing budgets, and that an obsession with efficiency has reduced marketing effectiveness over time. Before you reallocate, model what incremental profit each channel generates — not just what ROAS the last-click dashboard reports. A channel with a "worse" ROI might deliver far more incremental volume than your highest-efficiency line item.
Step 4: Run structured tests in the gaps you've identified. Treat new channel allocation as learning investment with a defined thesis, timeline, and success criteria. If competitive data shows your category's spend is overwhelmingly concentrated on Meta and TikTok, test programmatic display or CTV with a budget large enough to generate statistically meaningful results. Set your share of voice above your current market share in the test channel — small brands can steal disproportionate attention when they punch above their weight in places competitors have abandoned.
Step 5: Build a feedback loop that compresses the question-to-answer cycle. The old workflow — pull data, build a deck, schedule a meeting, debate, decide — takes weeks. AI-powered platforms now enable marketers to create a faster route from question to answer by querying competitive signals in natural language and receiving contextualized insights on demand. Make competitive audits a weekly habit, not a quarterly exercise. The brands winning on efficiency aren't the ones with the biggest budgets; they're the ones whose reallocation cycle operates in days, not months.
This playbook isn't about abandoning social — it's about refusing to let social's gravitational pull distort your entire channel strategy by default. Spy smarter, reallocate faster, and let competitive intelligence dictate where your next dollar works hardest.
Receive top converting landing pages in your inbox every week from us.
In-Depth
Discover how multi-location brands can unify local SEO, out-of-home (OOH) advertising, and native ad intelligence to make smarter marketing decisions across every market. Learn how to connect location data, search intent, creative testing, and performance measurement to identify winning messages, improve local visibility, and allocate budgets more effectively.
Priya Kapoor
7 minOct 24, 2026
Must Read
Discover how AI-driven search and agentic shopping are reshaping traffic, advertising visibility, and the performance marketing funnel. Learn how to use competitive ad intelligence and AI search insights to uncover emerging buyer priorities, strengthen campaign messaging, build more effective landing pages, and identify opportunities beyond traditional clicks.
Samantha Reed
7 minOct 24, 2026
Must Read
Discover how AI-generated ad fatigue is making native, push, and TikTok campaigns increasingly look alike, weakening engagement and reducing competitive advantage. Learn how to use competitive ad intelligence tools to identify repetitive creative patterns, develop more distinctive ads, and stand out in AI-driven advertising auctions.
Liam O’Connor
7 minOct 14, 2026