6 minOctober 12, 2026

Our spy tools monitor millions of TikTok ads from over 55+ countries. Biggest TikTok Ad Library in E-commerce and Mobile Apps!
Try It FREEFor decades, OOH lived in a strange double reality. Everyone in marketing agreed that a giant board over a packed freeway or a dominance buy at a transit hub drove awareness. But when performance budgets were divvied up, OOH lost out to channels that could tell neat stories in dashboards and last-click reports. You could point to traffic counts and GRPs; you couldn’t point to a cart check-out and say, “That came from this anstrex.com/blog/beyond-the-billboard-designing-cross-channel-funnels-when-your-ooh-partners-dont-speak-performance-yet" target="_blank" rel="noreferrer noopener">billboard.”
That asymmetry is finally disappearing. OOH’s traditional strengths—mass reach, physical proximity to real-world decision points—haven’t changed. What’s changed is the instrumentation wrapped around those assets. Location signals, mobile panels, computer vision and unified planning platforms now tie physical exposures to digital behaviors and, ultimately, to revenue. In other words, OOH has moved from static placements bought on intuition to full-funnel engines bought, optimized, and evaluated on proof.
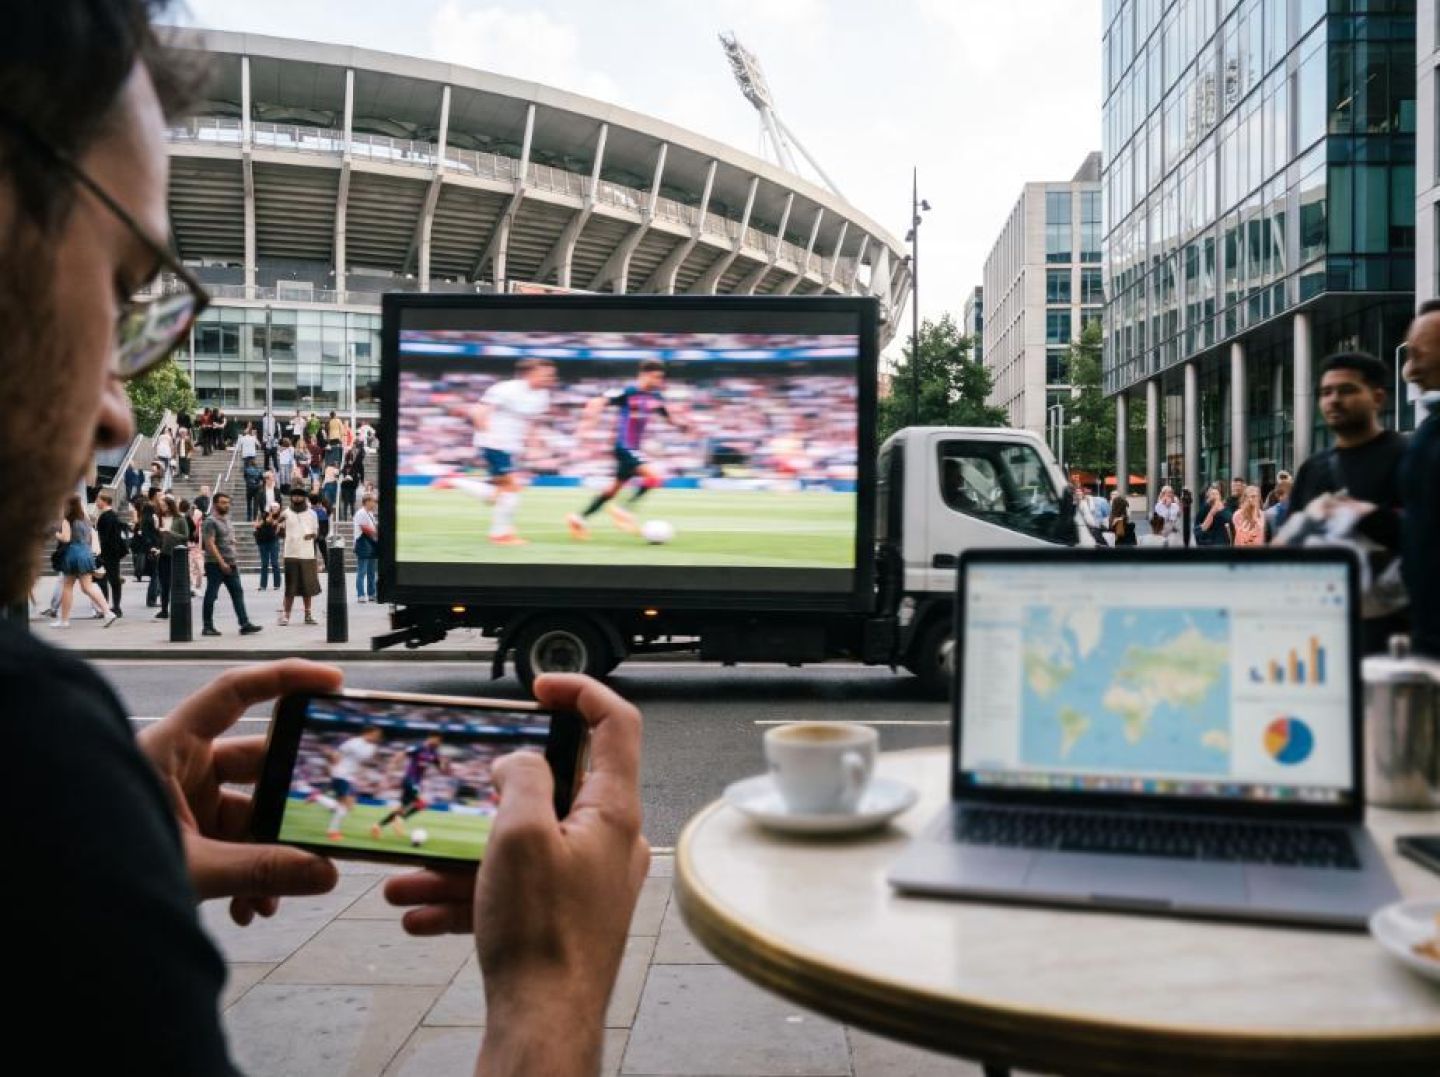
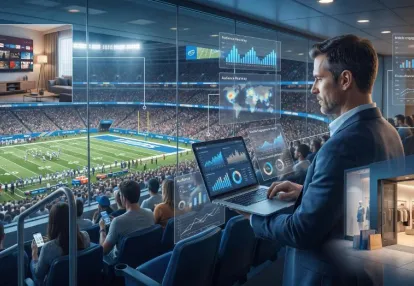
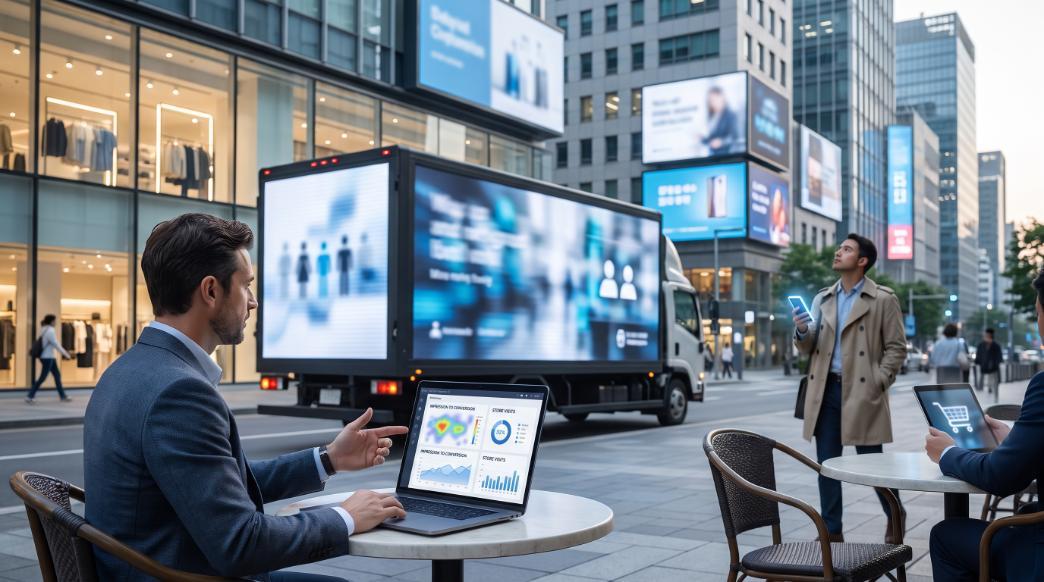
You can see that shift clearly in mobile OOH. In a recent San Jose Earthquakes campaign, a single LED billboard truck ran GPS-traced routes through the market with one deceptively simple question: can we connect OOH exposure to ticket sales, not just impressions? As the campaign recap in OOH Today explains, the answer hinged on “physical scale plus digital proof.” The truck created high-impact, real-world presence, while mobile data and point-of-sale integrations closed the loop from a moving screen in the street to verified ticket purchases in the system. That’s full-funnel OOH in practice: exposure, engagement, and conversion all traced back to a single asset.
Under the hood, this is being powered by a broader modernization of DOOH targeting and analytics. Where traditional OOH relied on coarse audience estimates, DOOH now taps into ticketing data, IR sensors, third-party measurement panels, and anonymized mobile location signals to model who was likely in front of a screen and when. As the team at Clearcode notes, you still can’t track individuals the way you would with cookies, but you can build robust, privacy-safe exposure models and compare them to behavior during and after the campaign. That’s a profound shift from “we ran 1 million playouts” to “we generated a measurable footfall lift and incremental conversions.”
The measurement conversation is also maturing beyond raw exposure into outcomes. Rather than accepting playout counts or basic impression estimates, sophisticated buyers are demanding verified impressions built from mobile location data, viewability and “likelihood to see” models, and tie-ins to outcomes like store visits, online sign-ups, or QR/NFC interaction. Clearcode points out that metrics such as footfall lift, brand lift studies, and on-screen engagement markers are replacing exposure-only reporting, giving OOH a language that looks a lot more like the performance vernacular used for display, social, and CTV.
Platforms are stitching all of this together into something that feels like a true performance channel. AdQuick, for example, positions its platform as a “universal adapter” that ingests consumer, demographic, and behavioral data, then uses AI to analyze trillions of potential OOH combinations to find the most efficient, highest-impact plan. By feeding real-time location, mobility, and performance signals into planning and optimization, they’ve turned OOH from a one-off awareness buy into a continuously optimized, multi-market system that sits alongside other programmatic channels in the same DSP, as described in their own product overview.
The industry still has work to do. As Jawad Hassan argues in his piece on rethinking measurement, fragmented methodologies and inconsistent metrics across operators and markets make it hard to compare OOH apples-to-apples with other media—or even with itself. But the trajectory is clear: OOH is evolving rapidly toward a single, interoperable measurement spine that plugs into the same data ecosystem as the rest of your media mix.
The result is a fundamental reframe. OOH is no longer just “location, location, location.” It’s an addressable layer across the physical world that you can plan, measure, and optimize like any digital channel—only now with the added leverage of real-world presence. Once you can quantify that impact across the funnel, OOH stops being the line item you defend in brand reviews and becomes the engine you rely on to drive high-ROI, multi-channel performance.
“Location, location, location” used to be a strategy. Now it’s just table stakes.
In the classic OOH playbook, success started and ended with securing the “right” board: a high-traffic freeway, a dominant wallscape, a marquee transit hub. GRPs and average daily traffic were treated as proxies for value, and the job was essentially done once a media buyer could point to a map and a traffic count.
That world is gone.
Three structural shifts have turned pure placement into a commodity: the explosion of digital inventory, the rise of data-rich buying platforms, and the expectation that every channel participates in a measurable, multi-touch journey.
First, OOH is no longer a finite set of static panels. The rapid growth of digital formats and programmatic pipes means there is far more supply in far more places than most buyers can manually evaluate. As Jawad Hassan explains, the medium is now “dynamic and responsive,” increasingly aligned with how digital media works. When you can light up or dial down thousands of units in real time, the question stops being “Is this a good corner?” and becomes “Is this corner the best use of my next incremental dollar given everything else I’m running?”
Second, intelligence has caught up with inventory. Platforms like AdQuick’s “universal adapter” analyze trillions of potential combinations of units using demographic, behavioral, and contextual data. The unit itself matters less than the pattern it participates in: which specific faces, in which sequence, against which audience signals, at which times, in support of which digital tactics. A board that looks “worse” on traffic alone may be far more valuable when an AI-driven system sees that it over-indexes for your core audience and sits in a corridor where exposed users consistently go on to search, visit a store, or convert online.
Third, speed of learning has become a competitive moat. As OOH Today’s coverage of hellOOH puts it, the next era of OOH won’t be won by the companies with the most inventory, but by those with the “fastest intelligence loops.” Historically, OOH reporting answered “What happened?” after the fact. Now, predictive demand models and always-on campaign graphs help answer “What is happening, why, and what is likely to happen next?” That shift from static reporting to living, predictive modeling is incompatible with a one-and-done mindset about location.
The knock-on effect is that “being nearby” is a weak proxy for intent. Oakley’s omni-channel campaign with illumin and Cuebiq is instructive here. Driving visits to 172 stores across 41 states, they explicitly rejected simple radius targeting — the default manifestation of “location, location, location” — because being within five miles of a store revealed almost nothing about whether someone was a likely buyer. Instead, they built a multi-signal framework that fused geo-behavior, audience attributes, and real-time attribution to understand which exposures actually created in-store visits. The result was a 98% reduction in cost per visit, not because the stores moved, but because the strategy moved beyond geography alone.
Meanwhile, data sources that once lived only in the digital realm now inform how and where OOH gets activated. As Clearcode notes in its overview of DOOH, modern targeting leans on ticketing data, IR sensors, mobile location feeds, and even weather and time-of-day signals. Those inputs shift the strategic question away from “What’s the best board?” toward “When and where does my desired audience cluster, how do those exposures sync with their online behavior, and how does OOH plug into my broader DSP-driven plan?”
In this environment, clinging to “location, location, location” as a strategy is like buying search ads based only on keyword volume. Placement still matters, but it’s an ingredient, not the recipe. The brands and operators that will win aren’t the ones who simply own or buy the “best” corners; they’re the ones who can continuously translate OOH inventory insights into responsive, cross-channel funnels, where each impression is chosen for its role in the journey, not just its view from the street.
Most OOH programs still treat “data” as a planning input, not a living system. You pull some audience indexes, pick boards, launch — then wait for a post-campaign recap to confirm what you already suspected. By then, the budget is gone and the learning is stale.
Intelligence loops flip that script. Instead of one-way reporting, you design your funnel so every impression, visit, and competitive move feeds back into how you buy, message, and sequence media in near real time.
The next era of OOH won’t be won by whoever owns the most faces; it will be won by whoever can see demand and behavior earliest. Platforms like hellOOH are already showing how this works on the supply side: they ingest verified campaign history, map brands to agencies and decision‑makers, and model “what is happening, why, and what is likely to happen next” across markets.
You can borrow the same approach as a buyer:
Instead of asking, “What’s the best board in this city?”, you’re asking, “Where is demand outpacing supply, and where can I buy attention before everyone else notices?”
Digital OOH is not just another awareness touchpoint; it’s a high-scale sensor network for how people move, gather, and respond in the real world. Modern DOOH planning taps data sources like ticket sales, IR sensors, mobile movement data, and environmental triggers such as weather and time of day, as outlined in this overview of.
The key is to wire those signals into your funnel design:
When you buy DOOH through the same DSP as your display, mobile, and CTV, as platforms like AdQuick’s programmatic stack enable, DOOH stops being a silo. Exposed audiences can flow straight into retargeting pools and multi‑channel paths without manual list wrangling, and you can attribute DOOH’s contribution across the full journey instead of guessing its “halo effect” after the fact.
Competitive “spy” tools have trained marketers to obsess over rival placements: who’s on which board, with what creative. That has its place, but the higher‑ROI move is to spy on your own audience’s path to purchase and then rebuild your funnel around those observed behaviors.
The Oakley case study from illumin’s omni‑channel campaign is instructive. Oakley wasn’t just optimizing for cheap clicks; they paired a journey‑based display campaign with location intelligence from Cuebiq to understand which digital exposures actually corresponded with in‑store visits across 172 stores in 41 states. That closed‑loop visibility allowed them to:
You can replicate that mindset in OOH:
Once your market intelligence, exposure data, and outcome metrics are stitched together, you can let machines do what humans can’t: evaluate millions or trillions of possible OOH and DOOH combinations on the fly. Systems like AdQuick’s AI‑powered optimization engine already analyze demographic, behavioral, and performance data to determine where each incremental dollar should land.
The practical output for your funnel is simple but powerful:
Reverse-engineering an offline-first funnel starts with a deceptively simple question: if someone saw your truck yesterday, what would you want to be able to do with them today?
Most brands still answer that in vague terms: “build awareness,” “drive consideration,” “lift intent.” But modern OOH measurement has evolved to the point where you can literally trace a line from a rolling billboard to a TikTok retargeting pool — and do it with the same rigor you’d apply to a paid social campaign.
Consider the San Jose Earthquakes campaign Lime Media detailed as “one truck, two days, one market.” A single LED billboard truck ran GPS-logged routes, while a mobile data partner matched device IDs seen along those routes to subsequent actions: website visits, ticket purchases, and everything in between. As the campaign recap in OOH Today notes, the point wasn’t just reach; it was “physical scale, digital proof.” The truck created the offline exposure; mobile location and digital logs closed the loop.
That’s the blueprint for an offline-first funnel:
2. Translate exposure into an addressable audience.
The people who were in proximity to your truck or board during your flight become an “OOH-exposed” segment. Modern platforms can now deliver those exposure logs to the same DSPs that run your display and social, meaning you’re not just counting impressions — you’re building a portable audience graph. As AdQuick’s platform overview emphasizes, when OOH impressions are captured and scored in real time, they can be treated with “parity with modern performance channels,” feeding downstream optimization instead of sitting in a PDF recap.
3. Design digital steps that respect the offline context.
Someone who saw your truck at a stadium tailgate is in a different mindset than someone who passed a screen in a mall at 10 a.m. Reverse-engineering the funnel means starting from that moment and asking: what is the next lowest-friction action we want?
The Oakley omnichannel campaign built with illumin and Cuebiq is instructive here. Instead of blunt radius targeting, Oakley used a “sophisticated targeting matrix” that fused geo-behavioral data with real-time attribution, so they weren’t just finding people near their 172 stores; they were finding people whose movement patterns indicated likely store visitation. That same logic applies when you’re chaining truck impressions to TikTok: you target not just geography but behavior and recency.
4. Upgrade “retargeting” to “journey design.”
Reverse-engineering an offline-first funnel doesn’t mean slapping generic remarketing on everyone who walked past your assets. It means mapping a sequenced journey that starts from the truck and fans out across channels:
5. Let attribution drive the next route, not just the next report.
When out-of-home is wired into your DSP and analytics stack, attribution stops being a postmortem and becomes an input. In Oakley’s case, real-time visit data let the team reweight spend toward markets and creatives that were actually driving in-store visits, cutting cost-per-visit by 98% over the course of just six weeks, as illumin’s case study details. Applied to a truck or DOOH-heavy plan, that same feedback loop might tell you which neighborhoods to double down on, which creatives warrant extra TikTok weight, or when to pivot from awareness-heavy sequences to conversion-focused ones.
The thread running through all of this is inversion. Instead of asking, “How do we extend our digital funnel offline?”, you start with the truck, the board, the screen — and design forward from that moment of physical presence into TikTok, display, CTV, and search. Offline isn’t a top-of-funnel black box anymore. It’s the first, most tangible touch in a measurable, multi-channel system you can continuously refine.
Hybrid journeys don’t care which team owns the budget. A shopper doesn’t distinguish between “experiential,” “mobile OOH,” and “digital”; they just experience a series of moments that either add up to a story or feel like disconnected noise. The job now is to orchestrate those moments so the truck, the screen, and the feed behave like one system.
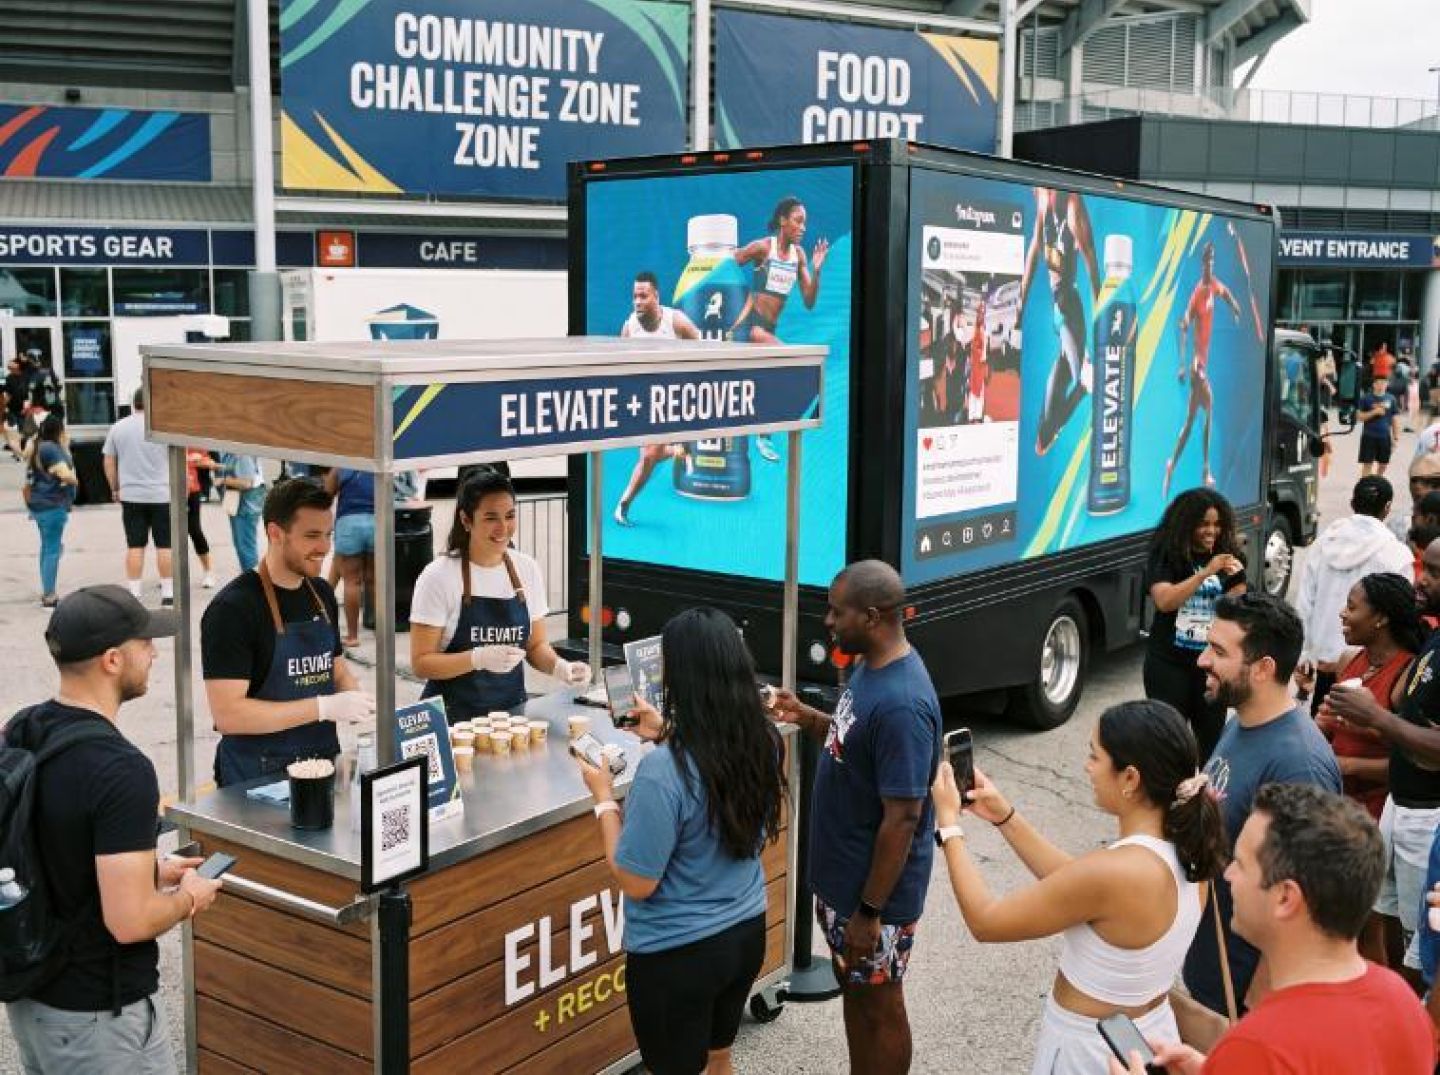
At the physical edge of that system sits experiential. When Lime Media describes its model as operating at “the intersection of experiential and OOH,” it’s because their 250+ asset experiential fleet and 100 digital mobile billboard trucks are planned as a single program, not as separate line items in a spreadsheet. In their hybrid shopper analysis, they argue that the real brief is no longer “where to put an ad,” but “where the brand needs to physically exist in order to matter in this journey,” and that mindset shift unlocks how you architect the rest of the funnel.
Here’s a practical way to think about it.
An experiential activation creates a deep, high-intent moment: sampling at a tailgate, a pop-up “lab” outside a running trail, a hands-on product demo outside a stadium. Instead of treating that as a self-contained event, you position it as the apex of a short, location-aware funnel that your mobile OOH and digital media both feed and harvest.
Mobile OOH plays the role of dynamic perimeter. A single LED truck running GPS-optimized routes can blanket an area with pre-awareness and post-exposure reinforcement while also generating a stream of device IDs that were likely in-view of the creative. In the San Jose Earthquakes case, Lime Media used one LED truck over two days as both “physical scale” and “digital proof,” connecting GPS-traced routes to verified ticket sales by matching exposed devices to purchase events later on. That kind of closed-loop methodology turns what used to be a fuzzy awareness tactic into a measurable performance engine.
Now layer digital on top of that.
The Oakley omni-channel campaign is a useful blueprint for what this orchestration looks like at scale. Their goal was to push highly efficient in-store visits across 172 stores in 41 states, while maintaining strong CTR to keep digital working hard for brand equity. To do it, Oakley and illumin used a geo-targeted, audience-first matrix rather than blunt radius buys, pairing a journey advertising platform with a location partner to see, in near real time, which impressions were actually turning into store visits. By optimizing mid-flight on visit data instead of waiting for a post-mortem, they cut cost per in-store visit by 98%, proving that precise localization plus rapid optimization can make offline outcomes behave like a digital performance metric.
Once you’re thinking in journeys instead of placements, the choreography becomes fairly straightforward:
When those three layers—experiential, mobile OOH, and digital—are planned as one, you stop asking whether OOH “drove awareness” and start asking much sharper questions: Which routes created the most incremental store visits? Which activation markets generated the highest-quality retargeting pools? Which creative sequences turned truck impressions into CTV exposures, then into store visits or ticket sales? That is what it means to orchestrate a hybrid journey: not just stacking channels, but wiring them so every physical touchpoint becomes a digital signal, and every digital signal points back to a place where your brand physically matters.
If you want OOH to earn performance dollars, you have to design it like a performance system. That means three things: creative that is built for behavior, landing environments that are tuned to the context of the impression, and attribution that can survive the jump from a sidewalk or street to a screen and then to a sale.
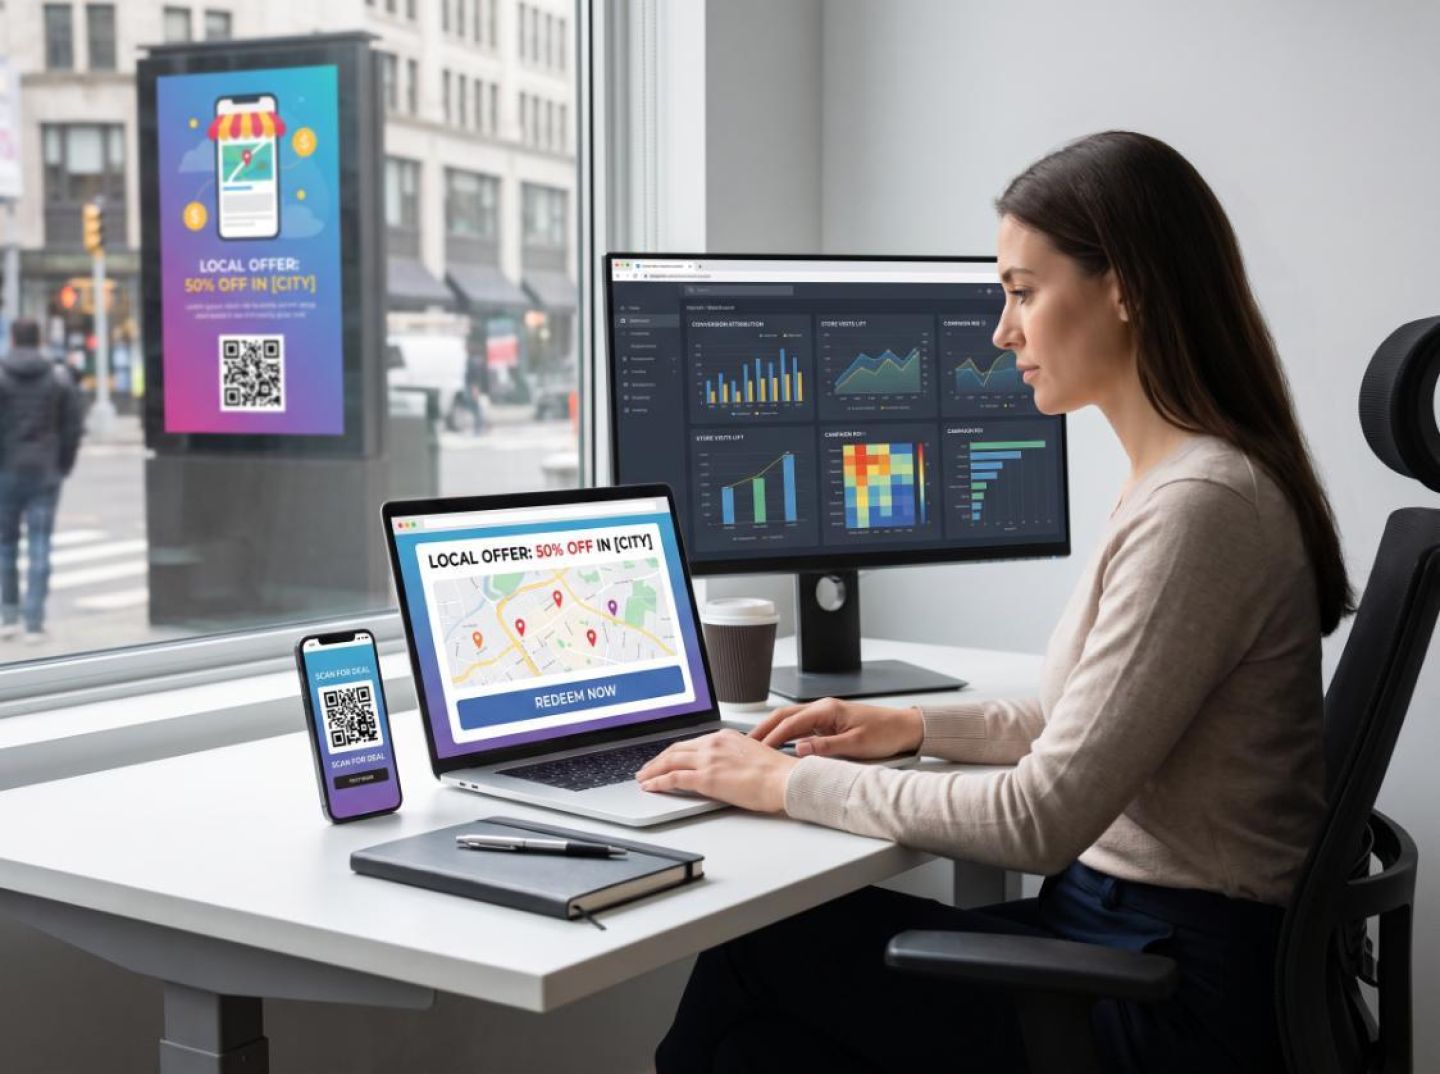
Most OOH creative is still written as if the only job is “be seen.” But the brands closing the loop are writing to a specific next step. A mobile billboard promoting a match isn’t just saying “Go Quakes”—it’s telling you “Buy tickets for Saturday’s match” and showing a short, scannable URL, QR code, or NFC prompt that can be acted on in seconds. When Lime Media traced the impact of a single LED truck for the San Jose Earthquakes, they paired “physical scale” with “digital proof” by treating the truck like a high-impact performance placement: routes were GPS-tracked, creative was tightly tied to a ticketing action, and measurement focused on verified purchases rather than vague lift, demonstrating how mobile OOH can finally “close the full‑funnel loop” between impression and transaction in a specific market over specific days, rather than as a fuzzy halo over time, as described in their analysis of the.
The other shift is from audience to moment. A placement outside a clinic, a screen near a checkout lane, a truck circling office parks at lunch—these aren’t just GRP machines; they’re prompts delivered at the point where the distance between attention and action can be a matter of a few hundred feet. As one analysis of place‑based inventory pointed out, “where someone works, shops, eats, receives care, commutes or socializes provides context about what they may do next,” and the core advantage of OOH is increasingly its ability to reach people when the surrounding environment makes the message more urgent and actionable, moving OOH “closer to the sale” in both physical and behavioral terms by leveraging the immediate context of a commute, a wait, or a purchase moment rather than generic reach across a city, as.
But even the best moment-based creative dies if the landing experience is generic. A truck that drives awareness for 172 stores should not be driving everyone to the same homepage. In Oakley’s omni‑channel campaign, the team used a data‑rich targeting matrix to connect digital impressions to specific locations, then optimized toward in‑store visits in real time, cutting cost‑per‑visit by 98% by making each impression point to the nearest relevant store rather than to an abstract brand promise, and by ensuring the post‑click experience mirrored the localized intent of the ad, according to illumin’s case study on Oakley’s approach. Apply that logic to OOH and your QR codes and short links should resolve to localized landing pages that auto‑detect the closest location, preload relevant inventory or offers, and integrate with store operating hours or appointment availability. If the board sits outside a pharmacy, the landing page should foreground the service featured on the sign at that exact location, with one clear call to action that can be completed before the red light turns green.
On the back end, attribution is no longer a guessing game. Modern OOH platforms ingest mobile location data, ticketing feeds, IR sensors, third‑party measurement, and environmental signals like weather and time of day to estimate impressions and tie them to outcomes in ways that mirror digital’s rigor. As one overview of DOOH infrastructure notes, attribution now routinely combines mobile location graphs, venue traffic counters, and event data, so that conversion analysis isn’t limited to raw reach but can compare exposed audiences against control groups across the campaign lifecycle, enabling full‑funnel metrics even without cookies or device‑level IDs, as described in this breakdown of DOOH targeting and analytics. When that data is fed in real time into a DSP that also manages your display, mobile, and CTV, OOH‑exposed audiences can be suppressed or retargeted just like site visitors, and the “halo effect” of OOH on adjacent channels can be quantified rather than hand‑waved. Platforms that analyze “trillions of possible combinations of OOH units” with machine learning are already treating OOH as a “strategic, performance channel,” aligning inventory decisions with the same optimization logic you use elsewhere so OOH isn’t an outlier but a full citizen of your performance stack, as outlined in the description of.
When creative, landing environments, and measurement are built on the same behavioral blueprint, a truck or a screen stops being a beautiful offline flourish and becomes one more accountable node in a multi‑channel funnel. The work isn’t to prove that OOH “drives awareness”; it’s to make it obvious how each impression moves a person from a moment in the world to a measurable action in your business.
Tags
Receive top converting landing pages in your inbox every week from us.
How-To
Learn how to connect out-of-home (OOH) advertising with digital performance campaigns to create measurable cross-channel funnels. Discover how to plan LED truck routes, coordinate search and social ads, optimize mobile landing pages, and track conversions so physical advertising drives measurable business results.
Samantha Reed
7 minOct 13, 2026
How-To
Discover how big-brand sports sponsorships use fan behavior, geographic targeting, and cross-channel advertising to reach high-intent audiences beyond celebrity endorsements. Learn how to reverse-engineer sponsorship strategies, validate audience segments with competitive intelligence, and build cost-effective campaigns around local fandom, CTV, mobile, and creator content.
Dan Smith
7 minOct 12, 2026
Guide
Discover how out-of-home (OOH) advertising can drive measurable conversions by connecting physical placements with digital performance campaigns. Learn how to use location intelligence, competitive insights, mobile OOH, TikTok retargeting, localized landing pages, and attribution to build high-ROI multi-channel funnels.
Rachel Thompson
7 minOct 12, 2026