
Our spy tools monitor millions of push notification ads from over 90+ countries and thousands of publishers.
Get StartedMeasurement failure isn't a niche concern in 2026 — it's the defining crisis of the marketing industry. Across every channel, every format, and every budget line, the same confession keeps surfacing: we don't actually know what's working, and the tools we've been relying on are lying to us in ways we can no longer afford to ignore.
Start with the channels where you'd expect measurement to be hardest. Out-of-home advertisers have been watching budgets evaporate because brands measure mobile LED campaigns through a direct attribution lens, miss the organic search lift and in-store visits that happen days or weeks after exposure, and conclude the channel underperformed. The budget gets cut. A competitor picks up the market share. The measurement didn't fail because the data was unavailable — it failed because marketers forced a lower-funnel framework onto an upper-funnel channel and treated the mismatch as evidence rather than error.
Now look at what should be the industry's most forward-looking discipline. Enterprise marketers investing heavily in AI search report sky-high confidence — two-thirds say they're "very confident" in measuring outcomes, and 80% claim AI attribution is clearer than traditional SEO. But dig one layer deeper and the facade cracks: 66% of those same executives report challenges with the basics of measurement, and fewer than one in five say they face no measurement challenges at all. As Mohammed Faizan of M&C Saatchi Performance put it, teams are confident in what they can see — "a small, clean edge of the funnel: clear referrals from AI platforms, last-click Anstrex.com/blog/the-impact-of-native-advertising-on-conversions-and-sales" target="_blank" rel="noreferrer noopener">conversions" — while AI's real influence hides inside branded search growth, direct traffic lift, and unexplained conversion spikes that current attribution frameworks simply aren't built to capture.
The problem isn't limited to emerging channels. Even performance marketing — the discipline that built its entire reputation on measurability — is hitting a wall. As AdExchanger documented, two decades of optimizing for demand capture have created a dangerous blind spot where brands keep getting better at competing for today's buyers while underinvesting in creating tomorrow's. Customer acquisition costs rise, conversion rates fall, and the metrics that once made everyone look good — marketers, vendors, and the C-suite — start telling a story of diminishing returns. Meanwhile, according to Forrester data cited in a Marketing Dive analysis of the accountability gap, 64% of B2B marketing leaders don't trust their own organization's measurement for decision-making. AI isn't solving this — it's scaling automation on top of weak inputs and unclear accountability, producing answers nobody fully trusts at a speed nobody can audit.
This is the landscape: OOH gets killed by the wrong lens. AI search marketers confuse visibility with validity. Performance marketing's greatest strength — provable ROI — is eroding under its own weight. And streaming platforms are only now proving they can drive lower-funnel outcomes after years of being slotted into the "reach bucket" because nobody stopped to question inherited measurement playbooks.
Here's the uncomfortable irony: push and pop advertising — a mature performance channel with deep technical instrumentation, real-time tracking capabilities, and granular conversion data — suffers from the same measurement gap. Not because the data doesn't exist, but because marketers default to the same lazy, self-reported platform metrics that every other channel is now publicly admitting are broken. The infrastructure is there. The will to use it properly isn't. And that gap between available data and actual insight is where ROI goes to die.
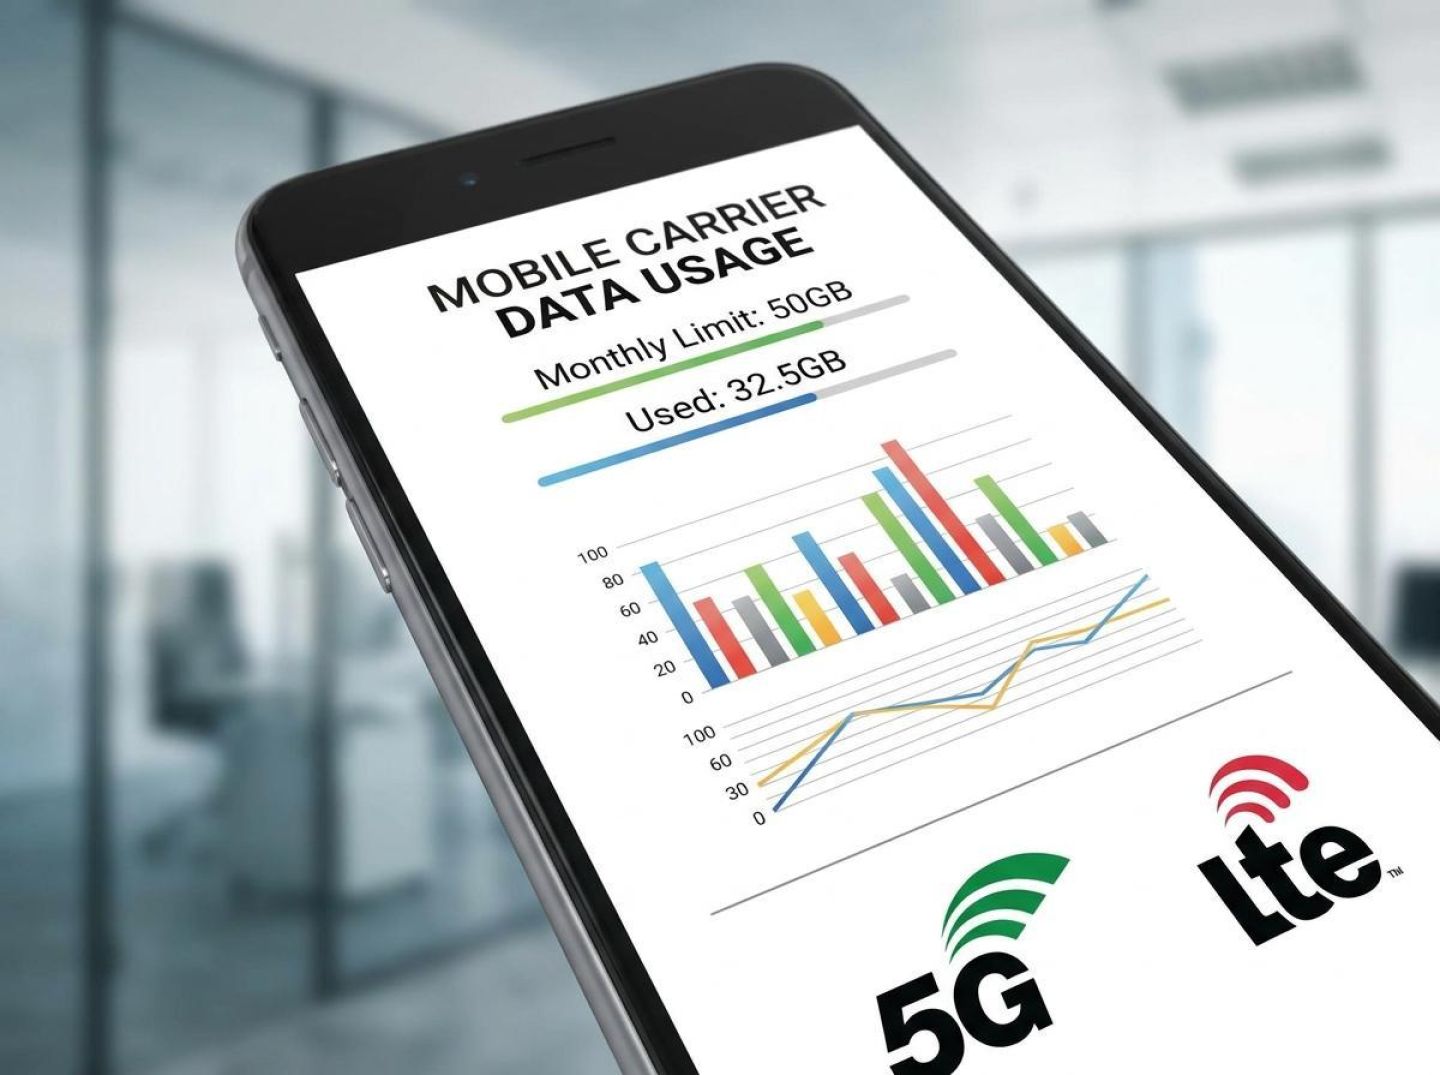
The push and pop channel has its own version of this measurement crisis, and it's hiding in a layer most buyers never think to examine: the carrier-device layer sitting between the click and the conversion.
Here's how it typically works. A media buyer launches a push or pop campaign, watches the dashboard, and optimizes on the numbers staring back at them — CTR, cost-per-click, maybe a surface-level conversion rate aggregated across all traffic. When performance dips, they adjust bids, swap creatives, or cut entire GEOs. What they almost never do is segment performance by the combination of mobile carrier, device type, OS version, and connection quality that delivered each impression. And that's where the real story lives.
Consider what happens between the moment a user taps a push notification and the moment a landing page loads. On a mid-tier Android device running an older OS version over a congested carrier network, that page might take four or five seconds to render. The user bounces. The click registers, the visit technically counts, but no conversion follows. Meanwhile, the same creative served to a user on a flagship device over a faster carrier converts at three or four times the rate. In aggregate reporting, these two experiences are averaged together into a single blended metric that tells the buyer nothing useful. The carrier-device combination that actually converts gets drowned out by the one that doesn't, and the buyer optimizes against a phantom average that represents no real user.
This mirrors, at a granular technical layer, what AdExchanger describes as the blind spot created by performance marketing's own success: the tendency to capture demand you can see and measure while ignoring the structural dynamics that actually create or destroy value. In push and pop, the "demand capture" equivalent is optimizing on aggregate CTR — the metric that's easiest to report and defend. The "demand creation" equivalent is understanding which device-carrier segments generate real downstream revenue, even when their click volume looks small or their CPC looks expensive in a flat spreadsheet.
The parallel to out-of-home measurement is almost exact. As OOH Today documented, Saatva nearly killed its highest-performing channel because the brand evaluated mobile billboard campaigns through a direct-attribution digital lens that was structurally incapable of capturing the channel's actual impact — organic search lift, brand-direct traffic spikes, in-store visits weeks after exposure. The wrong lens made the best channel look like the worst. Push and pop buyers make the identical mistake every day, just one layer deeper. They cut a carrier segment in Indonesia or a device tier in Brazil because the blended numbers look weak, never realizing that a specific slice within that segment — say, Samsung Galaxy A-series devices on Telkomsel's 4G network — was quietly producing their lowest effective cost-per-acquisition. The aggregate lens murdered the insight.
This is the measurement gap nobody in push and pop is talking about. It isn't an upper-funnel attribution problem. It isn't a brand-versus-performance philosophical debate. It's a concrete, technical failure to decompose performance along the dimensions that actually determine whether a user ever sees, loads, and completes the action a campaign was built to drive. And until buyers start examining the carrier-device layer with the same rigor they apply to creative testing or bid optimization, they will keep making confident decisions based on data that systematically misrepresents what's working.
Self-reported platform data has a structural problem that no amount of dashboard polish will fix: it is designed to tell you what the network did, not what happened after it did it. When a push or pop ad network reports a click, it is reporting that its system registered a redirect. When it reports a conversion, it is reporting that a postback fired. What it cannot tell you — what it is architecturally incapable of telling you — is which carrier delivered that impression on which device type, how the user actually behaved on the landing page, or whether the "conversion" represented genuine engagement or a misfire from redirect chains and aggressive click behavior unique to certain device-carrier combinations. The dashboard aggregates everything into a single stream of clicks and conversions, flattening the carrier-device-creative matrix into numbers that look clean but explain nothing.
This is the push and pop equivalent of what Mohammed Faizan of M&C Saatchi Performance described when critiquing AI search measurement: "That's not measurement. That's noticing the obvious." Network dashboards show you the small, clean edge of campaign performance — the last-click conversions, the surface-level CTR — while the real signal hides underneath in dimensions the platform has no incentive to expose. A push campaign might show a 0.12% CTR across a GEO, but buried inside that number is a carrier segment converting at three times the average alongside another carrier segment generating nothing but accidental clicks from low-end Android devices with screens too small to distinguish the ad from the close button. The network's dashboard will never separate those two realities for you because its reporting layer was not built for buyer-side optimization. It was built to demonstrate delivery.
The gap between knowing this and doing something about it mirrors a pattern 51toCarbonZero uncovered in an entirely different domain. In their research on marketers and AI's environmental impact, 88% of senior marketing leaders acknowledged that AI was increasing their carbon footprint — but only 36% had comprehensively measured the actual effects. As 51toCarbonZero's CEO Richard Davis put it, "Businesses cannot effectively reduce what they are not measuring." That ratio maps almost perfectly onto the push and pop world. Most media buyers intuitively know their network dashboards are incomplete. They see the unexplained variance between reported conversions and actual downstream revenue. They notice that certain campaign segments seem to perform differently at different times of day without any variable they changed. But instead of treating independent device-level data and competitive intelligence as essential infrastructure, they treat it as optional — something to investigate "when there's time" or "when budgets allow."
This is the same governance failure 51toCarbonZero identified. Awareness without measurement is not a strategy; it is a comfortable form of neglect. Relying on self-reported network data to optimize a push or pop campaign is the equivalent of measuring your carbon footprint by asking your energy company whether they think you're doing okay. The energy company will tell you what they sold you. They will not tell you where the waste is, which appliances are drawing phantom loads, or whether your insulation is costing you more than your consumption patterns suggest. That audit requires an independent instrument pointed at something the seller has no reason to reveal.
Until push and pop buyers internalize that the network's job is to sell traffic and the buyer's job is to measure what that traffic actually does at the carrier-device layer, the measurement gap will persist — not because the data doesn't exist, but because the people who need it most keep accepting a summary from the party least motivated to provide detail.
The out-of-home advertising world already learned this lesson the hard way. When a mobile billboard operator tells a client "we drove 200 miles and reached thousands of people," that statement carries zero analytical weight — and the industry knows it. As the Milpitas mobile billboard case study demonstrated, real measurement requires three distinct layers: tracking (knowing exactly what happened), calculation (applying real-world filters to raw data), and reporting (translating results into stakeholder-ready metrics). That campaign logged 1,552 GPS pings across 204.1 miles, then filtered raw exposure through speed-based legibility discounts, screen visibility geometry, and pedestrian proximity before arriving at a defensible impression number. Push and pop buyers need to internalize the same principle: "we got 50,000 clicks at $0.003" is no more a measurement than "we drove 200 miles" is. It's a guess wrapped in a metric.
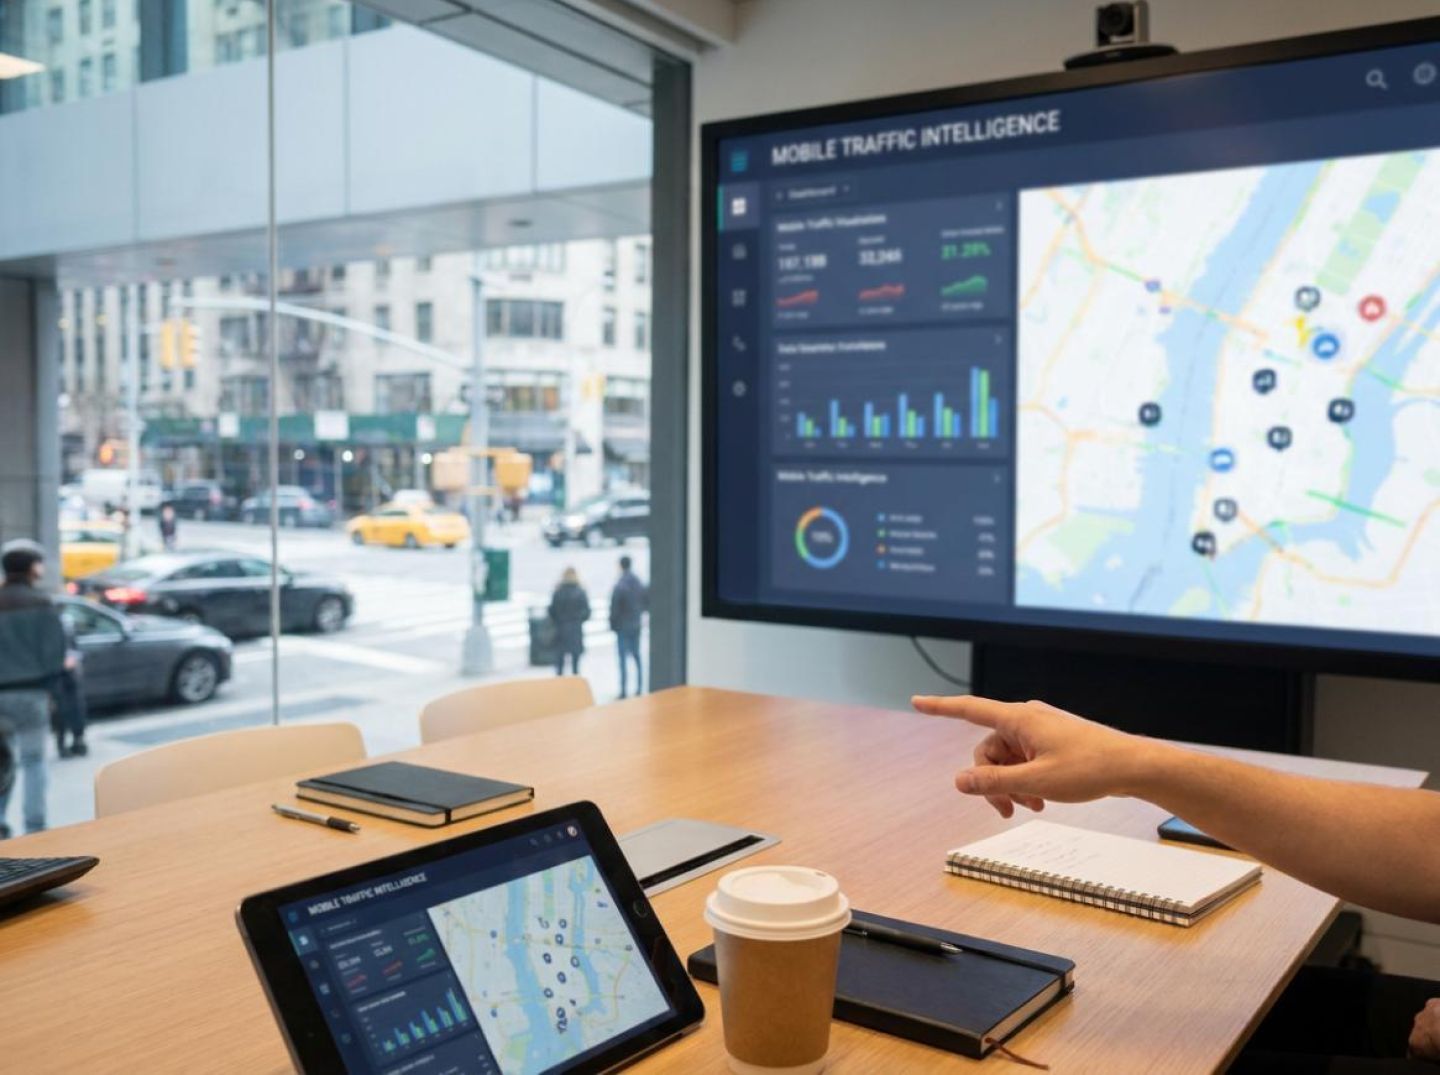
What changes when you move from self-reported network data to independently captured intelligence across real mobile traffic is not incremental — it's categorical. Across 130+ carriers and 80+ countries, the kind of data Anstrex Pops surfaces reveals analytical dimensions that network dashboards structurally cannot. Start with the carrier layer. Not all carriers deliver landing pages equally. Some mobile carriers route pop traffic through aggressive proxy compression, stripping JavaScript and breaking tracking pixels before the page ever renders. Others introduce latency that pushes load times past the threshold where a user bounces. These aren't edge cases — they're systematic patterns visible across millions of impressions, and they create entire carrier segments where you're paying for phantom traffic that never had a chance to convert. Knowing which carriers deliver pages that actually load and render versus which ones silently eat your budget is the difference between optimizing and guessing.
Then layer in device-OS combinations. A creative that converts on Samsung Galaxy devices running Android 13 through one Southeast Asian carrier may flatline on the same device through a different carrier in the same country, because the pop behavior, frequency capping, and rendering pipeline differ at the infrastructure level. These variations are invisible in aggregate network reporting, but they're plainly visible when you have independent cross-carrier data to compare against.
Pop frequency and timing patterns add another dimension. Carrier infrastructure determines how aggressively pops fire, how they queue during high-traffic periods, and whether users see one pop or five in a session. A campaign that looks like it's achieving broad reach may actually be hammering the same user pool at unsustainable frequencies on certain carriers while barely registering on others.
This is precisely the kind of gap that the digital audio industry is now confronting. As one executive argued when making the case for tagging every campaign for outcomes measurement, channels that can demonstrate they drive results earn budget allocation — channels that can't get cut. The same accountability logic applies here. Without an independent tracking layer that captures carrier-level delivery, device-level rendering, and real load-and-engagement data, push and pop buyers are optimizing inside a closed loop that rewards the network's version of events rather than reality.
Anstrex Pops provides that independent layer. It doesn't replace your network dashboard — it provides the foundational attribution context your dashboard was never designed to offer. When you can see which carrier-device-OS segments actually deliver convertible traffic at scale, you stop optimizing on phantom metrics and start building campaigns on verified ground truth. That's not competitive intelligence as a luxury. That's the minimum viable measurement stack the channel needs to mature.
The measurement gap isn't a mystery you need a year-long consulting engagement to solve. It's a structural problem with a finite number of moving parts, and you can start closing it this quarter with three deliberate moves.
Move One: Segment your historical data by carrier and device — ruthlessly. Most push and pop buyers analyze campaigns by GEO, offer, and maybe OS. Almost nobody breaks performance down by carrier and device model in combination. This is where hidden winners and losers live. A campaign that looks mediocre at the country level might contain a carrier segment converting at three times your blended average — buried under the dead weight of four other carriers dragging it down. Pull every campaign from the last 90 days, tag each conversion event by the carrier that delivered it and the device that rendered your landing page, and stack-rank the combinations. You will find segments you've been unknowingly subsidizing and segments you've been starving of budget. The network dashboard won't do this for you because it wasn't built to. Export the raw data, enrich it with the carrier and device fields your tracker captures, and build the view yourself.
Move Two: Benchmark your creative and landing page strategy against what's actually converting in your target segments. Once you know which carrier-device combinations are worth pursuing, use competitive intelligence tools to study what creatives, angles, and landing page structures are winning in those specific corridors. Don't guess what a Claro subscriber in Colombia responds to based on what worked for a Vodafone user in Germany. The whole point of segmentation is precision, and your creative strategy needs to match the resolution of your data. As Search Engine Journal reported, the imperative now is to embrace all channels and measure whatever you can, feeding your optimization models with more data rather than less. In push and pop, that means treating each carrier-device-GEO combination as its own micro-channel with its own creative requirements and its own performance ceiling.
Move Three: Build a feedback loop where independent data validates — or contradicts — your network dashboard. This is the move that separates media buyers who plateau from those who compound gains. Set up a parallel measurement layer: an independent tracker, a server-side conversion verification system, or even a manual audit cadence where you reconcile what the network says happened with what your own backend recorded. The discrepancies are the signal. When your network reports 400 conversions but your backend logged 310 confirmed actions, that 22.5% gap isn't noise — it's the precise shape of your measurement problem. As AdExchanger noted, performance marketing's biggest success created its biggest blind spot: the growth ceiling that emerges when you only optimize what's easy to measure. In push and pop, the easy measurement is the network postback. The hard measurement — the one that actually determines your ROI — is what happened on the other side of that postback, validated by data the network doesn't control.
Let the discrepancies guide your optimization. If carrier X consistently shows a 30% gap between reported and verified conversions while carrier Y holds within 5%, that's not a reason to complain to your account manager — it's a reason to reallocate budget to carrier Y immediately and investigate whether carrier X's traffic quality is fundamentally different. The feedback loop turns a static report into a living optimization engine. Run these three moves in sequence over the next 30 days, and you won't just close the measurement gap — you'll have built the infrastructure to keep it from reopening.
Receive top converting landing pages in your inbox every week from us.
Recently Updated
Learn how to turn award-winning brand campaigns into scalable Push, Pop, Native, TikTok, and dropship performance campaigns. This guide shows how to spy on proven funnels, extract the psychology behind successful creative, adapt big-brand concepts into direct-response angles, and use AI to produce high-velocity variations that can be judged by ROAS and CPA.
Liam O’Connor
7 minOct 3, 2026
Guide
Discover how performance marketers can turn award-worthy creative into scalable Native, Push, and Pop campaigns by separating creative fame from measurable performance. This guide shows how to use Anstrex, AI-driven testing, and modular funnel frameworks to reverse-engineer proven creative structures and scale the ones that actually convert.
Priya Kapoor
7 minOct 3, 2026
Must Read
Discover how Pure Leaf’s “Break Conference” can be deconstructed as a full-funnel strategy spanning Native, Push, and Pop advertising. This guide shows how marketers can use creator content, TikTok Instream, Anstrex, search data, and PR signals to turn a feel-good brand stunt into a measurable performance engine.
Priya Kapoor
7 minSep 27, 2026